Building Sales Territories Around Manufacturing Density
Map manufacturing activity, not geography, to unlock hidden pipeline opportunity.

Most sales teams still carve up manufacturing territory by state line or zip code, and that habit is quietly costing them pipeline. Geography measures land, not opportunity. Two regions of identical square footage can hold wildly different numbers of active plants, and the only variable that actually predicts demand is manufacturing density: how many facilities operate in a given area, what they make, and whether they're growing or standing still.
Consider the establishment-count numbers. California leads every state in manufacturing establishment count by a wide margin, with substantially more establishments than Texas. But many Midwest and Southeast states tend to run far larger plants on average. That single contrast should unsettle anyone who still draws territory lines by state border. A rep assigned "the West" isn't automatically sitting on better opportunity than a rep assigned "the Southeast," and the reverse doesn't hold either. Florida and New York, meanwhile, rank surprisingly high in establishment count, driven by food manufacturing, fabricated products, printing, plastics, and chemicals, industries that produce a long tail of smaller specialty manufacturers rather than a handful of giant plants. The map tells you nothing until you know what's actually inside the boundary.
Why manufacturing density varies so sharply by region
Manufacturing density is the concentration of active manufacturing facilities within a defined area, measured by count, by type, and by production activity, independent of how large that area is on a map. It has three parts. Establishment count answers how many distinct manufacturing locations sit in the region. Facility mix answers what those plants actually produce, food, metals, chemicals, plastics, and that mix decides which products and services have a market there. Activity signals answer whether those plants are expanding, adding equipment, or slowly winding down. A hundred dormant facilities are not a hundred buying centers.
Density doesn't distribute randomly. It clusters around industry investment. Semiconductor capacity has concentrated in Arizona, Texas, Ohio, and New York. EV and battery manufacturing has built up across a growing belt of Southern and Midwestern states. Auto assembly runs heaviest in South Carolina, Alabama, and Tennessee. Pharma and biotech cluster in a handful of states with established life-sciences infrastructure. None of this is incidental, it follows supply chains, labor pools, and incentive packages that took years to assemble.
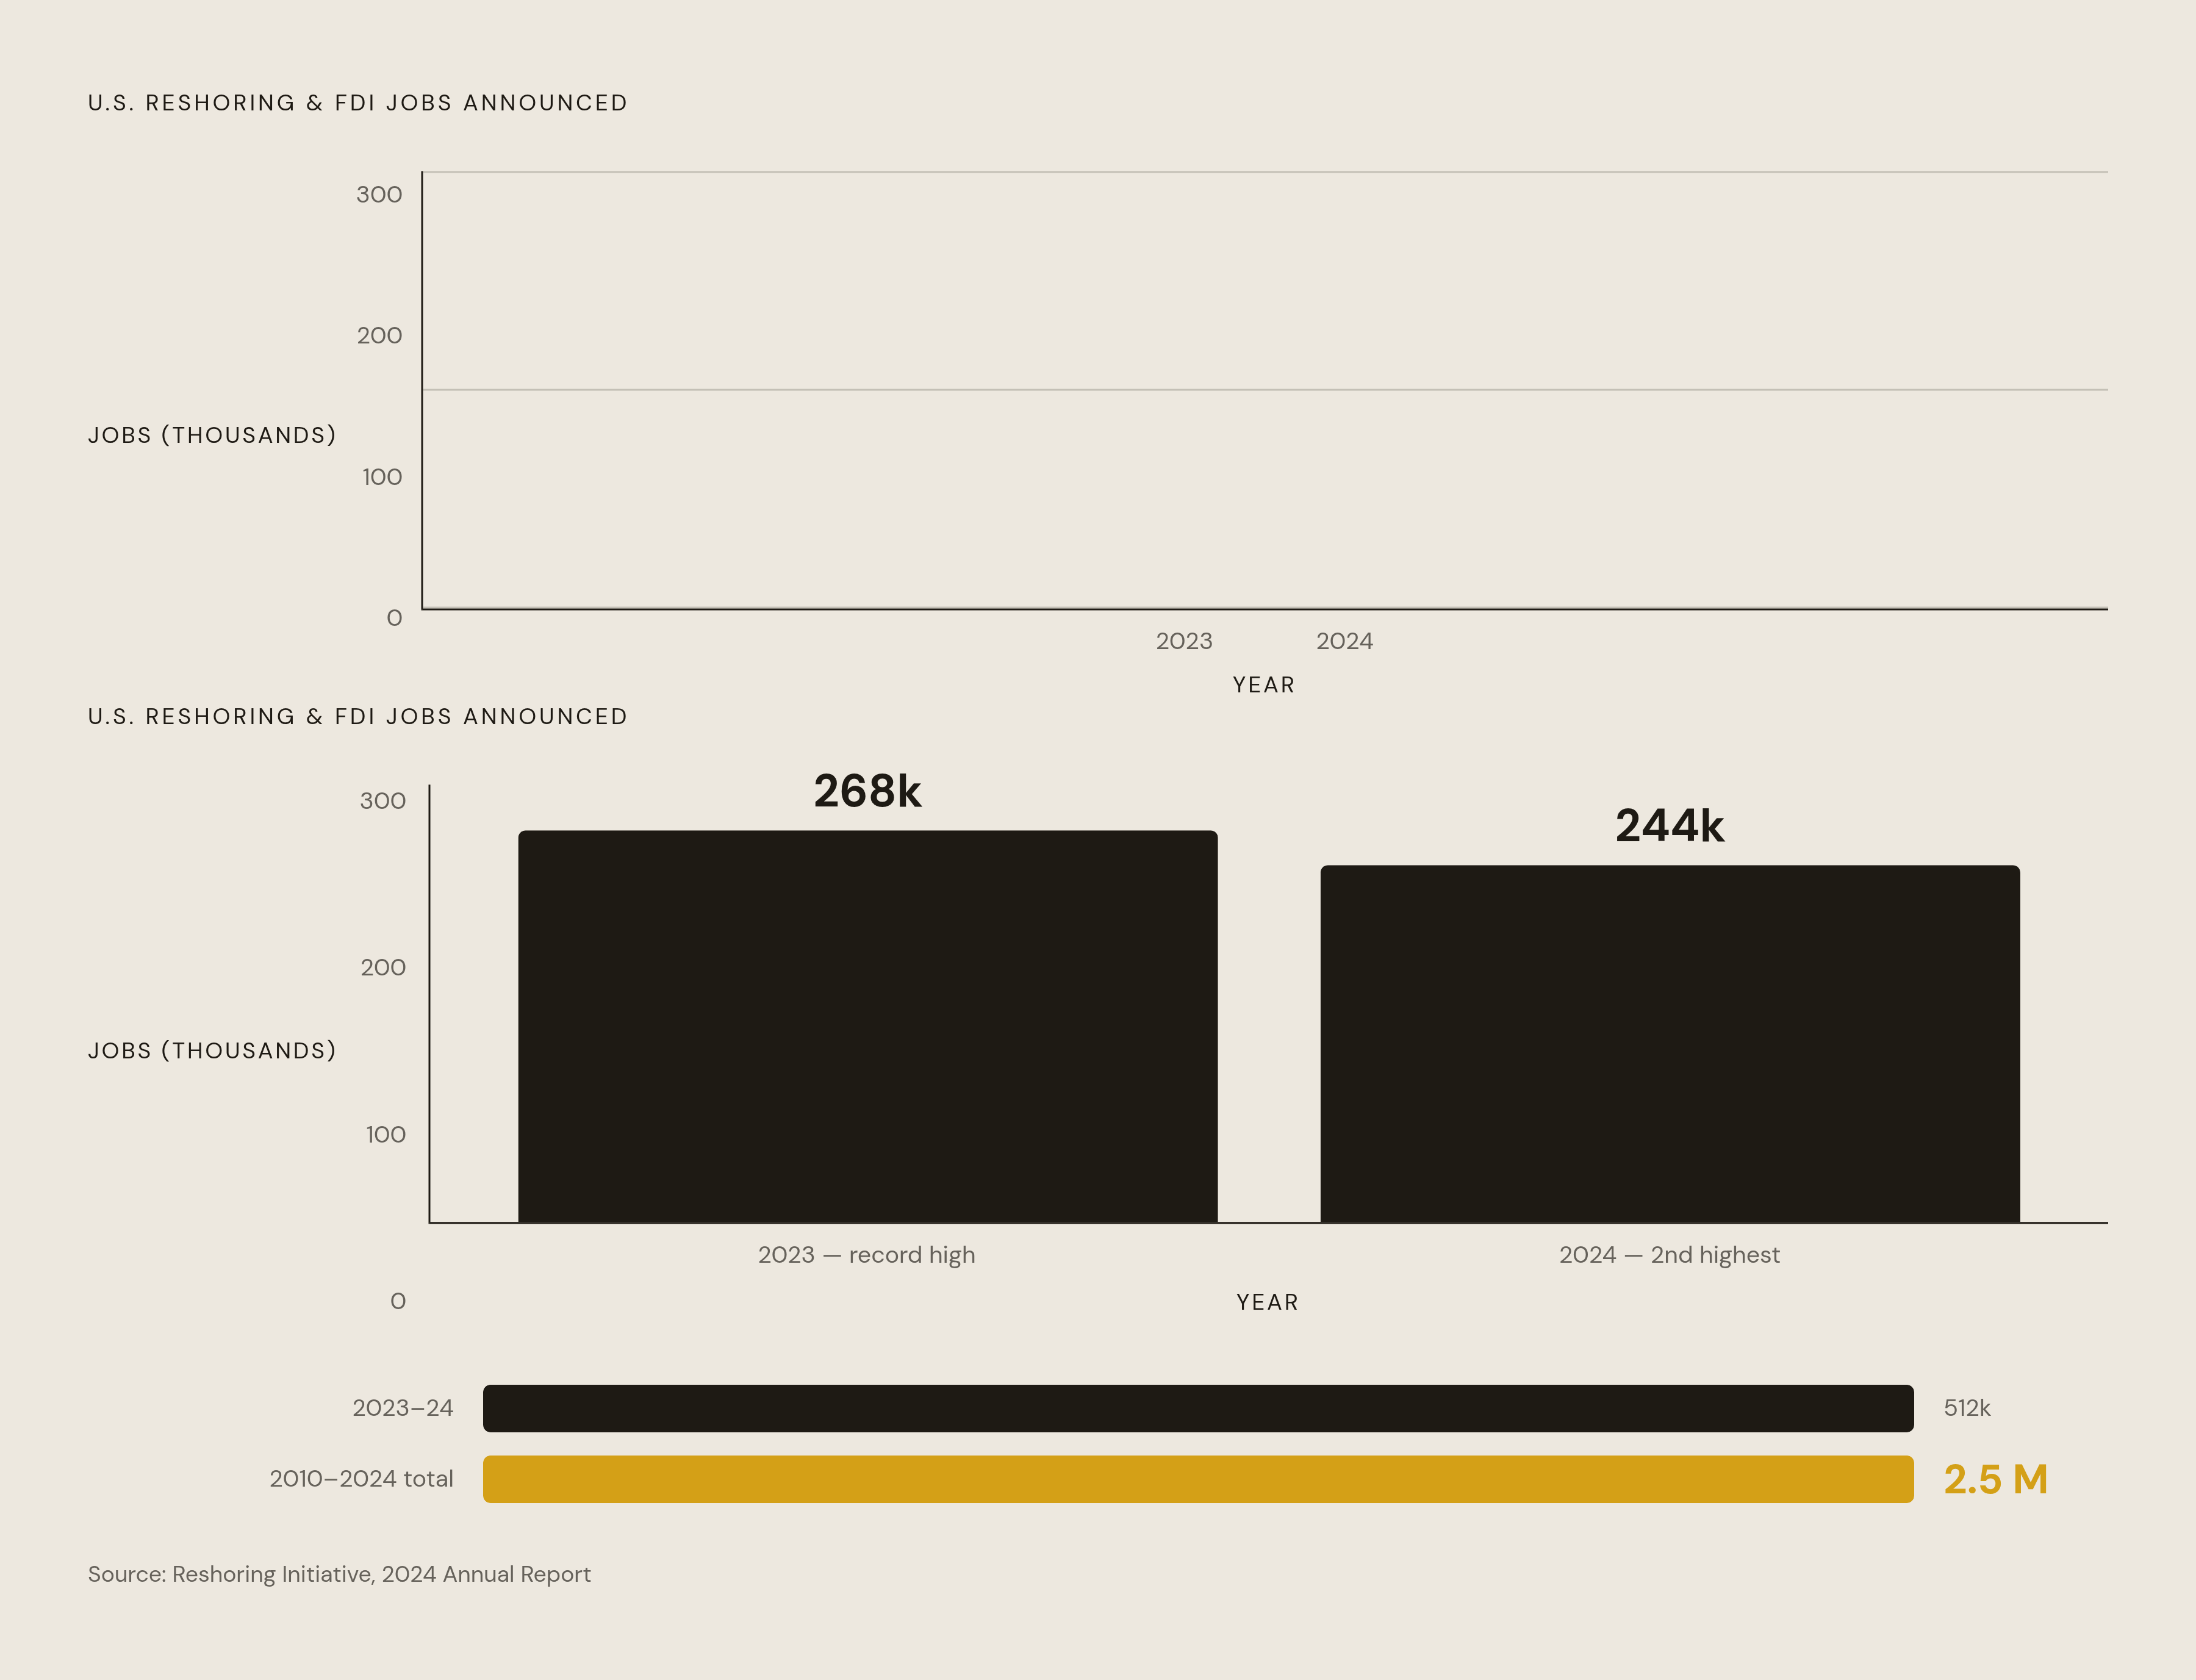
Reshoring is accelerating how fast these clusters shift. 2024 saw 244,000 reshoring and foreign-direct-investment-related jobs announced, the second-highest year on record behind 2023's 268,000, and the cumulative total since 2010 has passed 2.5 million. Five forces are compounding the trend at once: a substantial sum committed through the CHIPS Act and the IRA, 2025 tariffs narrowing the cost gap that used to favor offshore production, a broader push for supply chain resilience after the disruptions of the past several years, a total-cost recalculation showing logistics and IP costs eating up 15 to 20% of what looked like offshore savings, and automation closing the labor cost differential that once made offshoring an easy call. A density map built two or three years ago in an active reshoring state is probably already out of date.
The data sources that make manufacturing density measurable
The starting point for any density map is public. The Census Bureau's County Business Patterns API, queried against NAICS codes 31 through 33, gives establishment counts by state, county, zip code, metro area, and congressional district. It's the foundation, and it's free. The Annual Survey of Manufacturers goes deeper on establishments with paid employees, covering employment, payroll, hours, shipments, cost of materials, operating expenses, value added, and inventories down to the 6-digit NAICS level for industry statistics, though geographic breakdowns only go to the 4-digit level. The Economic Census, run in years ending in -2 and -7, adds detailed state and sub-state numbers on establishment count, employees, payroll, and sales by NAICS code.
All three share the same limitation: they're periodic, backward-looking, and built for industry aggregates rather than individual plants.
That's the real gap. NAICS codes classify industries, not facilities. NAICS 31-33 spans food and beverage, textiles, chemicals, plastics, metals, machinery, electronics, transportation equipment, furniture, and a dozen other categories, so a 2-digit code by itself is close to useless as a targeting signal. A facility coded under NAICS 332, fabricated metal, could be stamping sheet metal, machining precision parts, or running a welding line, and each of those implies different purchasing needs. Stopping at the top-level code is not a reliable targeting signal on its own. The fix is to check the 4-digit code alongside the plant's equipment list, website copy, and certifications before anyone gets routed to sales.
Plant-level commercial intelligence fills in what the public data can't. It surfaces verified decision-maker contacts by function and by plant. It flags equipment types and certifications like ISO 9001, AS9100, and IATF 16949 as qualifying signals. A press release announces project-phase and capital-investment activity, new facility announcements, expansions, relocations, and equipment modernization months before that same activity appears in Census data. And it can follow reshoring and clean-tech investment trends at the level of region, sector, and technology, rather than waiting for an annual aggregate to catch up. Public establishment counts tell a rep where facilities exist. Plant-level data tells the rep which of those facilities are active buying centers right now, and what they're likely to need.
Structuring territories around manufacturing density rather than geography
The governing rule is simple to state and hard to execute: balance territories by opportunity value, not by account count or acreage. Geography is not a proxy for revenue potential, so territory design has to weigh expected revenue against rep bandwidth directly. Workload scoring, multiplying account count by expected call frequency and deal complexity, gives a far more honest read on rep burden than a raw account tally ever could. Organizations that get this right see real payoff: territory design done well is associated with 10 to 20% higher sales productivity.
Density mapping works best paired with industry-based segmentation. In manufacturing, domain knowledge shapes buying decisions more than in almost any other sector, buyers expect a rep to already understand their compliance requirements, their operational constraints, their vocabulary. Assigning reps by process type (machining, stamping, forming) instead of by state builds credibility faster and shortens the sales cycle, because the rep isn't learning the account's world from scratch on the first call. The strongest model in practice combines both: a density-defined geographic anchor with a process or industry overlay on top, so each rep owns a coherent cluster of facilities that all need roughly the same expertise.
Field efficiency belongs in the design itself. SPOTIO's 2026 State of Field Sales survey found field reps spend just 43% of their time actually selling, the rest lost to non-selling activities. Density-mapped territories cut drive time by clustering plants that sit close together, rather than maximizing raw square mileage covered. A tight industrial corridor packed with facilities beats a sprawling rural territory with a handful of plants, even when the headcount numbers on paper look similar.
Reshoring hotspots deserve explicit handling here, not an annual refresh. The semiconductor corridor running through Arizona, Texas, Ohio, and New York; the EV and battery belt across Georgia, Kentucky, Tennessee, and Michigan; the pharma cluster in North Carolina, Massachusetts, and Indiana, these are density concentrations still forming, and a static yearly map will miss them until they're already mature. A territory plan that factors in announced greenfield investments, not just plants already operating, gets a rep in front of the buying committee before a competitor does.
Reading what a plant's production process signals about its purchasing needs
Production process determines purchasing pattern, almost mechanically. Every manufacturing facility, whether it's stamping metal or packaging food, consumes specialty chemicals, fluids, coatings, and packaging in patterns dictated by what it makes and how it makes it. A metal fabrication plant typically draws on multiple distinct purchasing streams, with different buyers and different decision timelines across its various process stages.
Machining operations are a clean example. Metalworking fluids handle lubrication and cooling across cutting, milling, grinding, and drilling. Whether a plant needs a neat oil, a semi-synthetic, or a soluble fluid depends on the operation type, and that's readable from the plant's equipment certifications and process descriptions before a rep ever picks up the phone. CNC machining, stamping, forming, and grinding each open a different product conversation.
These plants need lithium-ion battery materials (cathode powders, electrolytes, binders), thermal management fluids, specialty adhesives, and lightweight composites, a chemical purchasing profile that looks nothing like a traditional stamping plant's. Because EV and battery facilities concentrate heavily across a distinct regional belt, a rep covering that density cluster is having a categorically different conversation than a rep covering a legacy auto assembly territory nearby.
Before routing any facility to sales, the qualifying checklist stays short: equipment types operated at the plant, materials processed, certifications held, customer industries the plant serves, and example parts produced. Skipping that check means the rep shows up with the wrong pitch.
Navigating manufacturing buying committees from a territory perspective
Manufacturing buying committees run large and physically scattered. A typical group spans 6 to 10 stakeholders across engineering, procurement, operations, and executive leadership, and the practical starting point is mapping outward from the technical evaluator (often an engineering or plant manager) and the economic buyer (procurement director or VP of Operations). Other B2B research puts buying group size even higher across mid-market and enterprise deals generally, and manufacturing tends toward the larger end of that range because a purchasing decision can affect plant-floor operations directly.
Plant-floor decision-makers don't show up in conventional prospecting tools the way office-based buyers do. Line supervisors and plant managers often keep a thin LinkedIn presence, and general-purpose contact databases weren't built to carry plant-level operational certifications. A direct dial for a VP of Operations is worth more than a stack of generic contact emails, because manufacturing decision-makers spend their day on the floor, not at a desk checking inbox. Accurate contact data for industrial accounts needs to reach engineering, maintenance, facilities, purchasing, operations, plant management, safety, and IT, since any one of those functions might hold the actual veto.
Sales cycle length has to feed directly into territory design. Companies with 10,000 or more employees average 185-day sales cycles, roughly five times longer than what a small business runs. A territory dense with large single-site plants needs a different rep capacity model than a territory dense with many smaller facilities, even when the raw establishment count matches on paper. Intent data and predictive analytics can shrink that cycle by 30% or more, by timing outreach for when a prospect is already actively evaluating rather than cold. Rep capacity math has to account for committee size and cycle length by plant type, alongside drive time and headcount.
Making manufacturing density territories a continuous discipline rather than an annual exercise
An annual territory redraw treats density as a fixed fact, and reshoring has already proven it isn't one. New facility announcements, equipment modernization, and capital-investment commitments shift where the buying centers sit month over month, not year over year, especially in corridors tied to semiconductors, EV batteries, and pharma. A territory map finalized in January can miss a cluster of announced plants by June.
Treating density as a living input means checking establishment counts, facility mix, and activity signals on a rolling basis rather than waiting for the next planning cycle. It means updating rep assignments when a greenfield announcement lands in a corridor, not twelve months after the plant is already running. And it means holding the qualifying signals, equipment, certifications, materials, customer industries, as a permanent filter on every account entering the pipeline on a continuing basis. Manufacturing density is not a snapshot. It behaves like the industry it measures: constantly under construction.