Whitespace Analysis in Industrial Sales Territories
Manufacturers lose revenue to unmapped plants and untapped customers hiding in plain sight.

Territory drift from the manufacturing landscape
Whitespace, in territory terms, is the gap between what a sales org could be chasing and what it's actually chasing. In industrial sales that gap takes two forms: geographic whitespace, where qualified plants sit outside any rep's active coverage or get assigned and then forgotten, and account whitespace, where an existing customer relationship never expands past the first product line or the first buying center. Neither one announces itself. Nobody gets a notification that says "this plant should have been called eighteen months ago," and reps whose incentives run toward quota on known accounts have little reason to go digging for it.
Layering NAICS codes and headcount estimates onto a map just makes a bad picture look official. It just makes a bad picture look official, and that distinction matters more in manufacturing than in SaaS or professional services, because the industrial addressable market is finite and tied to physical facilities. A missed plant does not get recovered by widening the funnel or firing off more outbound sequences. It is lost, usually to a competitor who understood what the plant actually runs on its floor. The Sales Management Association found that 58% of B2B companies rate their own territory design as ineffective, and in a market where every plant is its own purchasing entity, that failure compounds account by account, plant by plant, rather than staying flat.
Most territories get built once, at a planning cycle or at company launch, then get carried forward year after year with minor tweaks. Manufacturing markets do not sit still long enough for that approach to hold. Plants relocate. They consolidate. Some close outright, ending operations for good rather than merely slowing them, while new facilities open in regions no rep map accounts for. The industrial mix shifts as one sub-sector expands and another contracts, and a fixed boundary cannot track that kind of movement. Capital investment follows its own logic, and it does not check with the org chart drawn up two years earlier.
Workload imbalance compounds the problem on its own. A rep carrying an oversized book, whether measured by account count, estimated revenue, or geographic sprawl, physically cannot cover everything assigned to them. The whitespace gets built into the design before the rep ever picks up the phone.
Data staleness undermines whatever is left. When CRM records go unrefreshed against current market conditions, sales leaders lose the ability to see where coverage has gone thin, and the analysis turns into guesswork dressed up as strategy. The same Sales Management Association research found that organizations with optimized territory plans report 10 to 20% greater sales productivity and 20% more revenue growth opportunity, a number that puts a real cost on drift.
Counting itself is the industrial-specific wrinkle. SaaS territories get measured in company count. Manufacturing territories should be measured in plant count and production profile, because a rep "covering 200 companies" might actually be covering 600 discrete facilities, or as few as 80, depending on how multi-site operators get rolled up in the data. Nobody knows which until somebody goes and counts the plants.
What SIC and NAICS codes can and cannot tell you about a facility
SIC and NAICS codes remain the backbone of industrial segmentation, and for good reason: when closed business clusters around a small number of codes, that pattern is worth following. SIC 2000 through 3999 broadly marks out manufacturing, and dropping to the 4-digit level sharpens the picture fast. SIC 34 covers fabricated metal products; inside it, 344 is structural metal, 345 is screw machine products, 346 is stampings and forgings, 349 catches the miscellaneous leftovers. A plastics operation under SIC 308 needs a different sales approach than a steel foundry under SIC 332, and a medical instruments maker under SIC 384 needs a different approach again. Different proof points, different buyers, different sales cycles.
The codes run out of road fast. They describe what industry a company sits in, not what a specific plant makes, at what volume, on what machines, using what consumables. Most published ideal customer profile frameworks come out of SaaS and tech sales, and the broad B2B intelligence platforms built to serve them sit on that same shallow firmographic layer. None of it gives an industrial seller the plant-level texture a real whitespace analysis needs.
Two plants can carry the identical 6-digit NAICS code and share almost nothing else. One runs high-speed stamping lines; the other does manual fabrication by hand. One has an on-site wastewater treatment system; the other trucks everything offsite. One burns through consumables on a 12-month cycle; the other reorders quarterly. NAICS works fine as a first layer, best paired with intent signals, org chart data, equipment profiles, and production volume, but on its own it cannot answer the only question a rep actually needs answered: should this plant get a call next week?
What plant-level production data reveals that classification cannot
A real plant-level profile holds what a NAICS record never will. What the facility actually makes, and how much of it. What equipment sits on the floor, and therefore what lubricants, chemicals, coatings, packaging, or water treatment it burns through. Its environmental footprint and compliance status. Whether it operates as a single site or as one node inside a multi-site network. Live activity signals: expansions, new equipment installs, hiring surges, capital expenditure announcements.
Capex announcements, facility expansions, and hiring surges are the strongest buying signals manufacturing sales has, and they are time-sensitive in a way static firmographic databases cannot capture. Industrial project reports that track planned facilities, expansions, relocations, renovations, and equipment modernization exist for exactly this reason. They are purpose-built buying signals, not generic company data repurposed for a job it was never designed to do.
Scale makes the point concrete. A single-state manufacturing database, as of September 17, 2026, covered 26,914 entities in California alone, each one a discrete sales target with its own production profile rather than a line item in a company-level record. A rep whose CRM shows 300 "accounts" in a territory may be standing in front of several thousand plant-level purchasing decisions, most of them invisible because they appear only when facility-level data is attached to the account record. Reading what a plant makes is really reading what it needs: a metalworking operation signals demand for cutting fluids and coolants, a food and beverage plant signals demand for specific sanitizing chemicals, coatings, and packaging. The production profile is the purchasing map. Classification codes were never built to draw it.
Mapping whitespace inside existing manufacturing accounts before hunting net-new
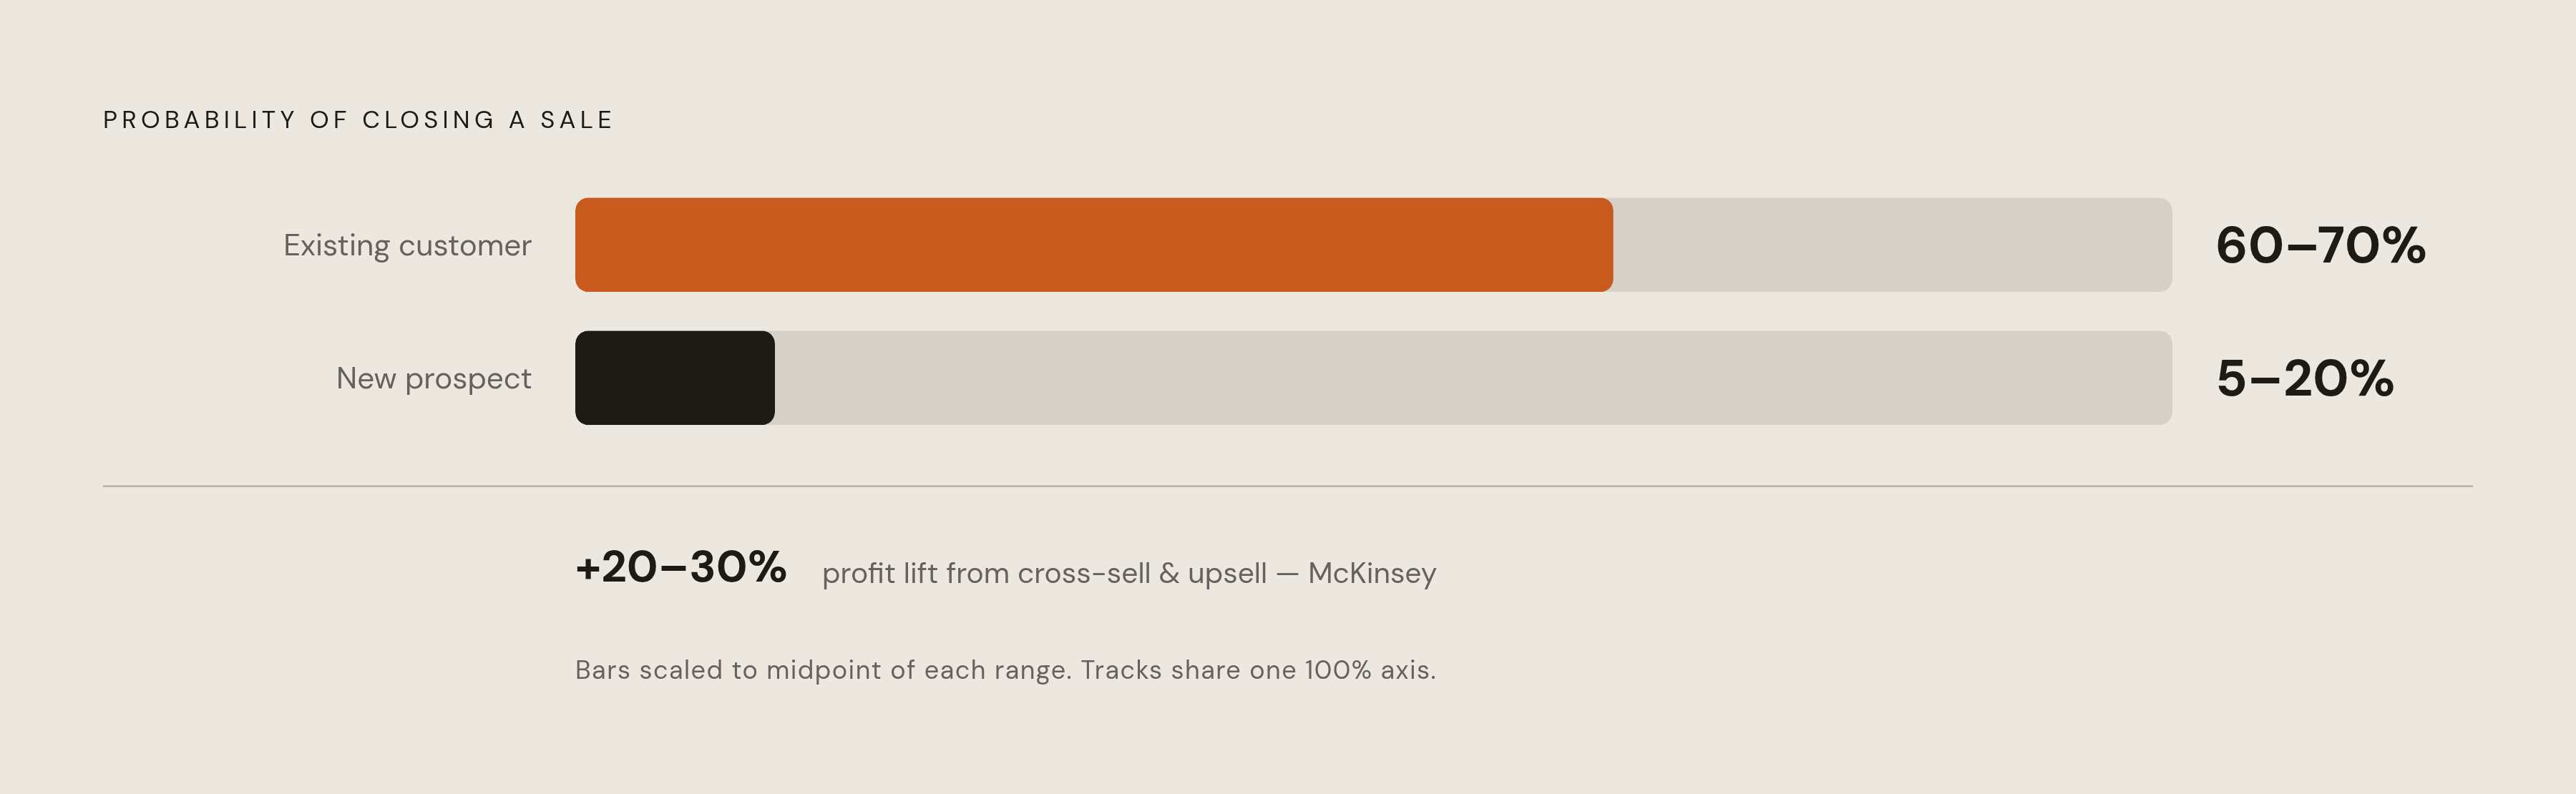
Before chasing net-new logos, the math says look inward first, and it is not close. Research from Invesp puts the odds of selling to an existing customer at 60 to 70%, against 5 to 20% for a brand-new prospect. McKinsey has found that the strongest cross-sell and upsell strategies can lift profits by 20 to 30%. Selling into an existing account is fishing where the fish already are. Chasing a net-new logo is casting blind, and most territory plans still spend the bulk of their energy on the blind cast.
DemandFarm's account landscape framework gives this a workable structure. List every offering in the portfolio, capped at roughly ten, using parent categories if the real catalog runs longer. Identify the buying centers inside the account, which in manufacturing usually means individual plant sites, divisions, or functions that each make their own purchasing call. Build a matrix crossing offerings against buying centers, populate it with closed-won, closed-lost, and active opportunities from the past 12 to 24 months, then score each cell for relevance and competitive pressure. The green cells, high relevance, high attractiveness, no current business, are the whitespace. It sits in plain view once the matrix exists.
Multi-site accounts are the single highest-leverage play here. Pulling ship-to locations and order frequency apart often reveals that some plants inside an account everybody thinks is "won" are quietly buying from a competitor, or buying from no one. Consolidation proposals built around volume-based agreements go directly at this gap. Watch for the trigger events specific to manufacturing: production scale-up, new equipment installs, expansion onto additional lines, compliance changes that force new chemical or packaging requirements, or M&A bringing an unfamiliar plant type under a familiar corporate name.
The failure mode here is close to universal, and it is a design failure. Most industrial sales teams track revenue at the account level rather than the plant level. They know they sell to a company. They do not know which of its twelve facilities they are absent from, or why nobody has ever asked.
Reading manufacturing buying org structure when mapping whitespace across a territory
Manufacturing buyers think operationally, not commercially, and any whitespace conversation that leans on "partnership" or "synergy" language is going to lose the room. Plant managers and operations directors care about uptime, throughput, safety, and cost per unit. Deal size dictates who actually holds the decision: under $25,000, the plant manager decides; between $25,000 and $100,000, an operations director or VP gets pulled in; above $100,000, corporate procurement enters the room.
That split makes multi-threading non-negotiable at scale. In practice, corporate contacts tend to control enterprise-wide budget and strategy, while facility contacts drive the actual evaluation and adoption on the floor. Whitespace at the enterprise level only opens up when both layers get engaged at once. A rep sitting on a strong relationship with one plant manager inside a five-site account can be completely blind to an expansion decision being made at corporate right now, and the reverse holds just as true.
Phone still works in manufacturing sales, at a moment when most other B2B outreach has fled to inboxes and professional networking platforms. Cold calls that open with specifics about what the plant actually runs cut through in a way generic pitches never will. None of this works without the right contact attached to it, though: whitespace needs an addressable name in engineering, maintenance, facilities, purchasing, operations, or safety. A plant profile without the right contact is an opportunity with no door to knock on.
Structuring a territory whitespace audit using plant-level data
Start by establishing the real facility count in the territory rather than the company count. A territory logged as 400 companies might sit on top of a manufacturing footprint running into the thousands once every plant gets counted separately, and that gap is usually the first sign of how much whitespace is hiding in plain sight.
From there, overlay current CRM coverage against that facility universe. Which plants are active accounts. Which are named in the system but untouched for 12 to 24 months. Which do not appear in the CRM at all, as if they do not exist. Segment what is left by production profile rather than SIC bucket, grouping plants by what they actually make and what that implies about what they need to buy. This is the production-reality layer that NAICS alone was never built to provide.
Score the unworked segment by fit and signal: capex announcements, hiring surges, equipment upgrades, production volume, and proximity to a rep's existing route, since route efficiency still matters even in a whitespace-first model. Run the within-account matrix against the top accounts at the same time as this outward mapping. The fastest whitespace to close usually sits inside a plant a rep already technically owns but has simply never visited.
CRM decay undercuts all of this if it goes unaddressed. B2B database records decay at a significant rate each year, and for industrial teams working an already-narrow total addressable market, that means the coverage map is wrong before the analysis even starts. Data enrichment is the precondition for the process to mean anything. Gartner has also tracked a 73% rise in territory management software adoption since 2012, which says the industry has started treating territory planning as a strategic discipline in its own right. Software does not fix what is missing, though. The intelligence layer, the plant-level data itself, still has to come from somewhere else.
The final output of an audit like this is a prioritized list of facilities with production context attached to each one. A rep needs to know what a plant makes, who to call there, and what to say when they do. A map with shading tells them none of that.
A whitespace-driven territory model in practice for industrial sellers
The hybrid model is the right answer for manufacturing sales, and the alternatives (pure geographic carve-up, pure vertical specialization with no territory bound) both break down at scale. A rep covers every account of a given production type, metalworking, food processing, whatever the vertical calls for, within a defined geography. That combines depth in one domain with the efficiency of a bounded region, instead of forcing a choice between the two.
Domain knowledge changes outcomes directly here. Manufacturing buyers expect a rep to already understand compliance requirements, operational constraints, and process specifics before the first call. A rep who walks in already knowing what a plant runs earns credibility faster and shortens the sales cycle that follows, because nobody has to spend the first two meetings on education.
Strategic named accounts should stay static, since relationship depth takes time to build and should not get disrupted by a reassignment. Whitespace accounts and smaller accounts should move as the facility map updates, because the territory is meant to function as a living document, not something printed once a year and left on a shelf. When territory design actually reflects manufacturing density on the ground, reps stop wasting hours on facilities that were never a fit, travel routes get built around clusters of relevant production instead of arbitrary geographic convenience, and cross-sell conversations start with production context already in hand instead of getting discovered awkwardly mid-call.
Forrester puts average quota attainment across industries at 47 to 50%. In industrial sales, where the territory is finite and every unworked plant is a specific, identifiable, recoverable revenue opportunity, closing that coverage gap moves the number directly, unlike markets where demand is diffuse and hard to pin to any one account. Platforms built specifically for manufacturing sales, ones that index facilities at the plant level with production profiles, equipment data, environmental footprint, and activity signals folded into CRM workflows, are what let a whole team run this model, rather than leaving it dependent on one rep's personal research habits.
The rep who knows what a plant makes before dialing the first number is not working harder than the one running off NAICS codes and headcount estimates. They are working off a more accurate map of the same territory, one where the whitespace has already been found before the call even starts.