Pipeline Generation Metrics That Matter in Industrial Sales
Manufacturing sales needs facility-level metrics, not software benchmarks.

Manufacturing sales pipelines are being measured with the wrong instruments. Metrics built for software, MQL counts, cost per lead, generic conversion rates, don't hold up against how industrial buying actually works: long cycles, distributed buying committees, and demand that lives at the plant, not the parent company. What predicts pipeline health in manufacturing sales is facility-level qualification, territory coverage against real manufacturing density, and how fast a rep reaches a contact after a real signal fires, not the numbers borrowed from a SaaS dashboard.
The vocabulary itself gives away where it came from. MQL counts, cost per lead, top-of-funnel conversion rates: these were built by and for software companies selling to a single buyer, closing in weeks, with a roughly uniform customer profile. None of that describes industrial sales. Buying committees in manufacturing run larger and pull in more distinct roles, cycles stretch out over months, and the actual unit of demand is the plant, not the company that owns it. Generic metrics count activity. They don't tell you whether that activity has anything to do with a facility that could plausibly buy from you.
The damage appears in three places at once. MQL counts inflate because they tally contacts at a company rather than contacts at a facility that runs the relevant process. Deal velocity benchmarks mislead because they average industrial cycles in with software deals that close in a fraction of the time, producing a midpoint that describes neither. And conversion targets pulled from cross-sector medians hide whether a deal is actually moving or just parked. Research has found that only a small fraction of companies hit 90%+ forecast accuracy. That gap between what the pipeline says and what actually closes is a measurement failure. It's a measurement failure, and it starts with tracking the wrong things from the first stage on.
Macro Environment's Impact on Manufacturing Pipeline Expectations
Manufacturing sector indicators pointed to contraction through much of 2025, not just slowing growth. Buyer behavior reflects that caution, with more caution, more deferral, fewer green lights. In a quarterly outlook survey from a manufacturing industry group, a large share of manufacturers have named trade uncertainty as their top concern. Procurement teams in that environment aren't just taking longer to decide. Many of them are choosing not to decide at all, at least for now.
Chemicals show the same pattern from a different angle. Growth forecasts for the sector have softened materially, with analysts projecting only modest expansion through 2026. Specialty chemicals hold up better on margin because they're harder to commoditize, but the macro headwind is real across the board.
Add to that how buyers already behave before a seller ever hears from them. Industry research consistently puts self-directed research at roughly 70% of the buying process before a supplier gets contacted. Sellers show up later in the conversation than they think they do, and a pipeline built on early-stage engagement metrics is measuring a phase that's mostly already over.
In a cautious buying environment, a pipeline full of poorly qualified accounts is worse than a thin, clean one. Coverage ratios don't mean anything if the accounts sitting inside them were never going to move. Timing matters because CapEx decisions in manufacturing track to specific planning cycles, a pattern generic metrics ignore. CapEx decisions in manufacturing track to specific annual planning cycles. OpEx spending on services and consumables can happen anytime, but it's triggered by specific production events, a line going down, a shift adding capacity, a new compliance requirement. A metric that can't see timing can't see half of what's driving the buy.
Before any of this can be measured well, a team needs to agree on what a qualified industrial opportunity actually looks like. Most haven't.
Common ICP Definition Mistakes in Industrial Sales Teams
For most B2B teams, the ideal customer profile is a paragraph, not a specification. It's directional instead of precise, and it produces prospecting lists that are too broad, feeding conversion rates that never quite recover.
In industrial sales, that vagueness turns into a structural problem, not just a sloppy one. A manufacturer classified under a single NAICS code might run a dozen facilities doing materially different things under that same umbrella. Headcount at the company level tells you nothing about what's actually running on a given plant floor. And a facility's purchasing needs follow what it makes and what equipment runs that production, not whatever category the parent company's SIC code implies.
The upside of fixing this isn't marginal. Fullcast's Benchmarks Report found that logo acquisition is eight times more efficient when accounts fit the ICP tightly, compared to loosely targeted lists. That's not a rounding error. That's the difference between a prospecting motion that works and one that quietly burns budget while looking busy.
Getting to that precision at the facility level means tracking a specific set of things: what the plant actually produces (the product itself, not the parent's category label), what equipment it runs (since that determines which consumables, chemicals, fluids, or coatings it needs), production volume and how close it's running to capacity, and environmental footprint signals that drive compliance-related purchasing.
Without that layer of detail, an MQL in industrial sales doesn't mean much. A "qualified" contact sitting inside a facility that doesn't run your process is noise wearing a pipeline's clothes. It's noise wearing a pipeline's clothes.
Once ICP is defined at the facility level, the next question is coverage: how much of the real, addressable manufacturing landscape a team is actually reaching. It's coverage: how much of the real, addressable manufacturing landscape a team is actually reaching.
Territory coverage against real manufacturing density: the baseline metric most teams don't track
Territory design usually runs on geography, revenue band, or named accounts. None of those map cleanly to where manufacturing demand actually sits. A rep can have a perfectly reasonable-looking territory on paper and still be working a tiny fraction of the facilities that would qualify inside it.
What share of the qualifying facilities in a territory is a rep actually reaching, coverage against real density, is the baseline. That ratio, coverage against real density, is the baseline. Everything downstream depends on it.
It matters more than the standard pipeline coverage ratio most sales orgs already track. A 3 to 5x pipeline coverage ratio, the conventional benchmark seen across ORM's customer base, means nothing if the accounts inside that pipeline represent only 15% of the facilities that actually qualify in the territory. The other 85% is the real problem, and it's invisible, because it never entered the CRM to begin with.
Assigning reps by industry sector rather than by ZIP code changes this. A rep who owns metalworking, or specialty chemicals, or coatings across a region builds domain fluency faster than one juggling five unrelated verticals in the same geography. That fluency appears in the questions a rep can ask on a first call, and it shortens cycles because buyers in specialized sectors expect a seller to already speak their language.
Static territories create a second measurement trap. ORM's customer data shows more than 10% of pipeline goes untouched for 12 months straight. In a territory that never gets restructured, that stale share tends to concentrate in accounts a rep wrote off early and simply never went back to.
The percentage of qualifying facilities with at least one active contact record, the percentage with a documented production profile (what the plant makes, what it runs), and the percentage with any activity logged in the last 90 days are worth tracking at the territory level. Review that quarterly at minimum. Territories drift, a plant adds a product line, a company cuts headcount, a market shifts, and a well-designed territory from a year ago can be badly misaligned today.
Knowing which facilities are covered is the starting condition. Reading production signals, not counting contacts, reveals which of those facilities are actually in-market right now.
Signal-to-contact timing: the industrial pipeline metric that replaces MQL rates
According to Forrester and Demand Gen Report data, MQL-to-SQL conversion fell from 13.1% in 2024 to 9.8% in 2026. The main driver is definitional drift: contacts get routed into the MQL bucket without any real behavioral or intent qualification behind them. Programs that add behavioral or intent signals to their MQL criteria report 16.4% MQL-to-SQL conversion, nearly 70% higher than the unfiltered median. Qualification criteria drive conversion, not lead volume.
In industrial sales, the equivalent of intent data is a production signal at the facility level. That includes plant expansions and new construction announcements, automation or smart-factory investment, a new VP of Operations or plant manager coming on board, CapEx tied to a specific production line, or a sustainability or compliance mandate that forces a new purchasing requirement. These signals carry more weight than most intent-data platforms offer for industrial markets, because they reflect actual change on the production floor, not someone reading a blog post.
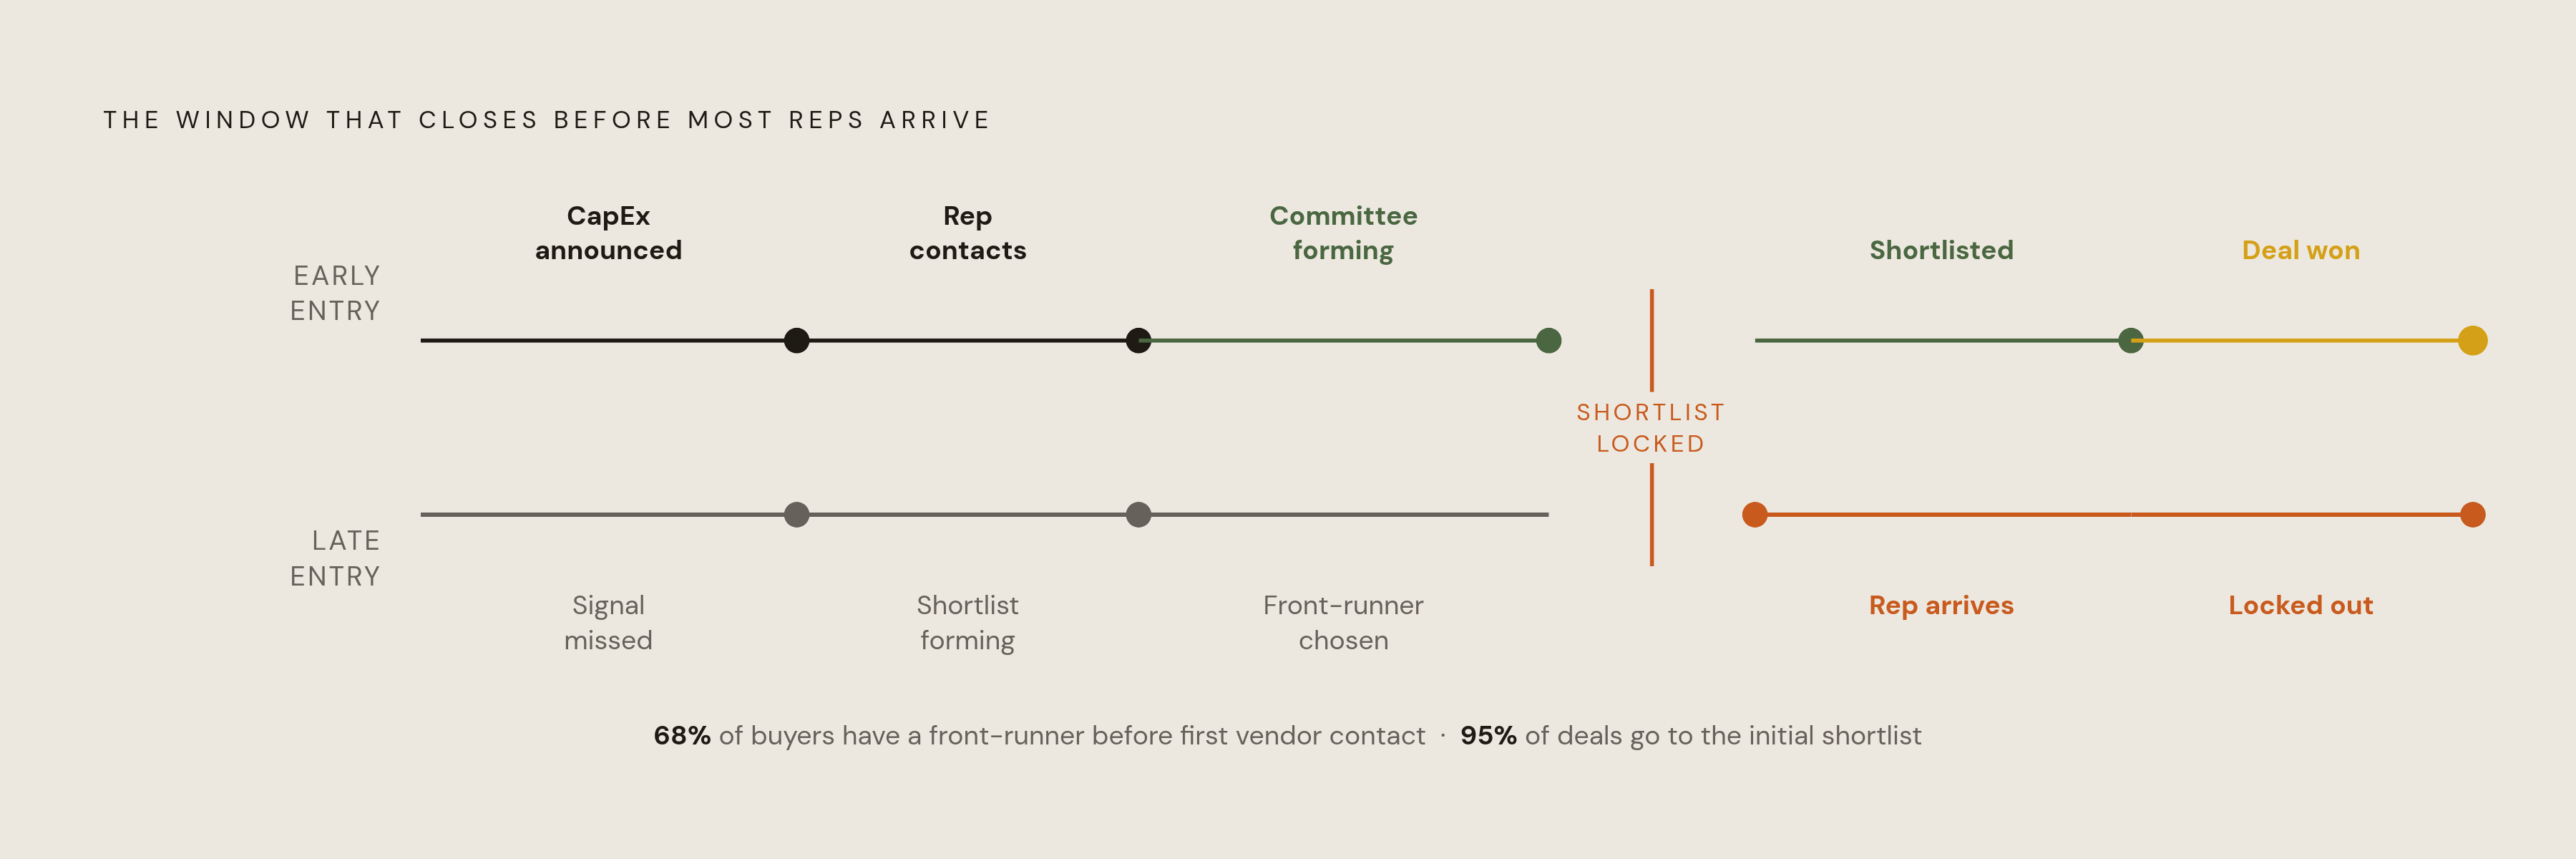
The metric that matters here is the time between when a signal is detected and when a qualified contact attempt happens. The shorter that lag, the better the odds of getting into the buying conversation from the start rather than trying to break in later. That timing gap is not a minor efficiency detail. 6sense has found that 95% of deals go to a vendor already on the buyer's initial shortlist, and Forrester data puts the number of B2B buyers with a front-runner picked before any vendor interaction at 68%. In a market with cycles this long, missing the signal window often means missing the deal, full stop, regardless of how good the pitch is later.
The buying committee makes this worse for latecomers. Plant managers, operations VPs, procurement directors, and often a CFO for anything capital-intensive, all with a seat at the table. A rep who arrives early can map that committee while it's still forming. A rep who arrives late is negotiating for a chair at a table that's already been set.
Timing into an account is a leading indicator. The lagging one, the number that tells whether qualification is actually working, is how the pipeline holds up once it's inside the cycle.
Pipeline velocity and conversion rates calibrated for industrial cycle lengths
Pipeline velocity combines deal volume, average deal size, win rate, and cycle length into one number describing how much revenue is moving through the pipe per day. Improve any one input and velocity goes up. The formula doesn't change in industrial sales. The inputs do, substantially.
Buying committees across B2B have grown larger and more complex, and cycles have stretched out materially since 2023. Industrial deals consistently sit toward the longer end of that range. That's why cross-sector velocity benchmarks mislead more than they help: blend a batch of SaaS deals closing in a few weeks with industrial cycles running 6 to 18 months, and the resulting average describes neither. A deal that looks stalled by SaaS standards might just be sitting in a normal hold pattern, waiting on CapEx sign-off or a Q4 budget release that hasn't landed yet.
Expected stage durations should be calibrated against a team's own historical data, broken out by deal type and facility size, not against some cross-industry norm that has nothing to do with how a plant actually buys. Stale deal share matters too. ORM's customer data shows only about 20% of day-one, in-quarter pipeline actually closes within that quarter. Knowing that realization rate is what makes a coverage ratio honest instead of decorative. And stakeholder engagement breadth per deal deserves its own line: a deal touching just one contact at a facility with a multi-person buying committee is a risk wearing a deal's clothes. It's a risk wearing a deal's clothes.
Bottom-of-funnel conversion for qualified opportunities in conventional B2B falls well short of most targets. In industrial sales, where the nurture period stretches out further, the team that keeps managing stakeholder relationships through the whole cycle beats the team that shows up mainly at the close. And on quota: Optifai's Sales Ops Benchmark puts manufacturing-specific quota attainment at 60%, five points below the cross-industry B2B average of 65%. That gap is structural, tied to cycle length and committee size, not a sign that industrial reps are underperforming. Plan against that baseline instead of treating it as something to explain away.
Velocity and conversion describe how pipeline that already exists is moving. Where new pipeline comes from, and what it costs to generate, is a separate question, and industrial teams need a different yardstick there too.
Cost-per-qualified-opportunity, not cost-per-lead, as the industrial efficiency metric
HubSpot's State of Marketing 2026 puts median B2B cost per lead at $213, up from $198 in 2025, an 11% year-over-year increase. The spread inside that number tells the real story: top-quartile CPL is $84, bottom-quartile is $397, a 4.7x gap. That spread follows a clear pattern. It's the difference between ICP discipline and volume-chasing. The industrial version of that same gap is the difference between targeting facilities that actually qualify and blasting a list built off company names.
Cost per lead is the wrong number for industrial teams to optimize, for a fairly specific reason. A "lead" attached to a company running multiple plants may or may not touch a facility where the product is even relevant. CPL optimizes for contact volume, but the real constraint in industrial sales is contacts sitting inside facilities that actually need what's being sold. It's contacts sitting inside facilities that actually need what's being sold. Landbase's 2026 qualification benchmark found that 67% of lost sales opportunities trace back to reps not properly qualifying leads in the first place, and in industrial contexts that failure usually happens at the facility level before it ever shows up as a contact-level mistake.
The better number is cost per qualified opportunity, where "qualified" means something specific: the facility is confirmed to run the relevant process or equipment, at least one buying-committee stakeholder has been identified and engaged, and a production signal or timing trigger has actually been documented. That's a higher bar than a form fill, and it should be.
Prospeo's 2026 B2B lead generation statistics report found marketing leaders estimate 25% of budget goes toward campaigns that look productive on a dashboard but don't move revenue. In industrial sales, that waste concentrates disproportionately in volume-based lead programs chasing company names instead of facility realities, exactly the pattern CPL rewards and cost-per-qualified-opportunity punishes.
Efficiency on the prospecting side is one half of the equation. The other half is what's already sitting in the book of business, where industrial teams tend to under-measure the most.
Expansion pipeline in manufacturing accounts: the metrics most industrial teams ignore
Teneo's 2026 B2B Software Vendor Survey found that 66% of B2B software growth in 2025 came from existing customers, and vendors expect that pattern to hold. Industrial sellers sit on an equivalent dynamic inside their existing plant relationships, and most aren't measuring it as its own category.
The probability math backs this up: Invesp data, referenced by Twilio, puts the odds of selling to an existing customer at 60 to 70%, against 5 to 20% for a brand-new prospect. Invesp data, referenced by Twilio, puts the odds of selling to an existing customer at 60 to 70%, against 5 to 20% for a brand-new prospect. In industrial sales, where a new-account cycle can run well over a year, that gap matters even more than it does in software.
The structural miss is simple to name: most industrial go-to-market teams treat expansion as a topic that comes up in a quarterly business review, not as a pipeline category with its own targets and its own metrics. That treatment undersells what's actually available inside accounts already won. Share of wallet per facility, additional process lines not yet served, adjacent plants within the same account that haven't been mapped, these are pipeline in every meaningful sense, and they deserve to be tracked with the same rigor as new-logo pipeline, not folded into a status update once a quarter and then forgotten until the next one.
Sources
- Lead Generation Statistics 2026: 80+ B2B Benchmarks That Drive Pipeline
- Top 4 B2B Lead Generation Tools to Grow Your Pipeline in 2026 - Directive
- 21 Sales Pipeline Statistics That Prove AI-Driven GTM Is Essential in 2026 | Landbase
- Sales Pipeline Management in 2026: Metrics, Pipeline Health, Risk Detection
- Sales Pipeline Metrics | ORM
- fullcast.com
- Why Manufacturing Sales Pipelines Turned Unpredictable in 2026 | MANTEC