Market Coverage Benchmarks for Industrial Sales Teams
Territory coverage depends on facility-level production data, not company counts or geography.

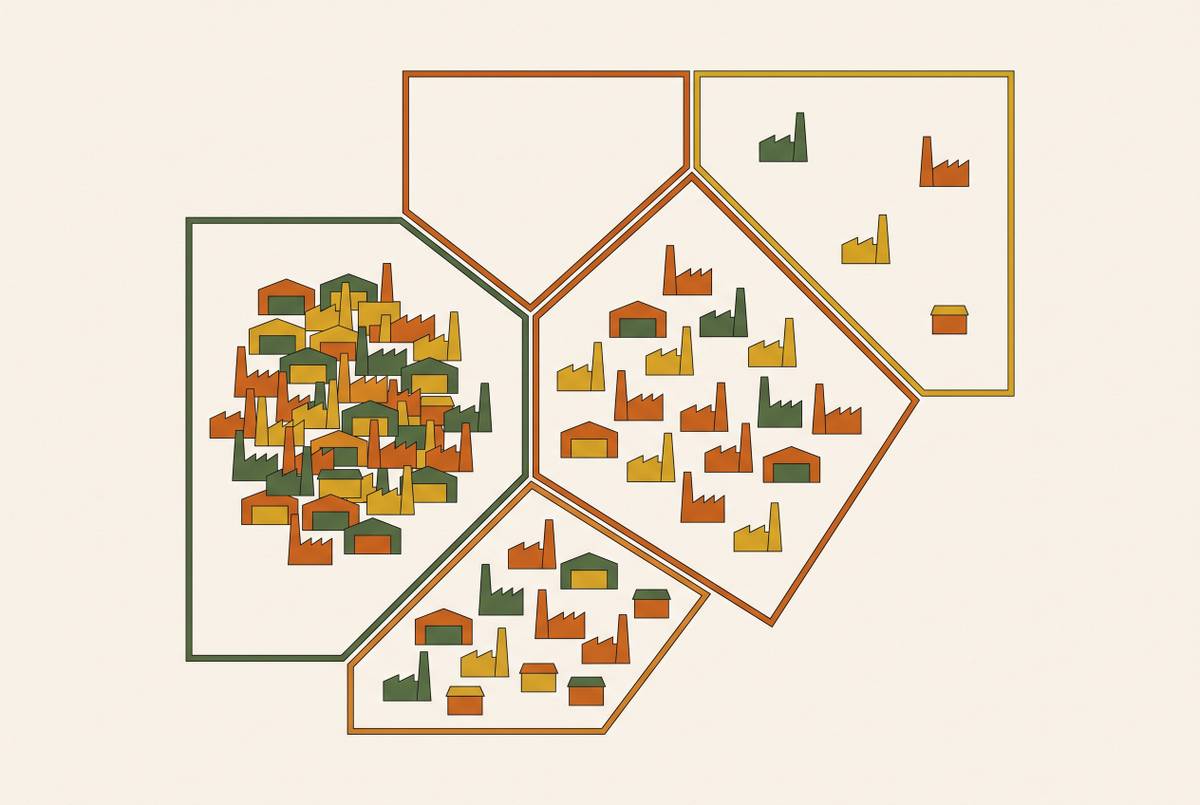
These benchmarks only mean something if you build them from plant-level production data, not company records. A territory that looks fully staffed on a CRM dashboard can still miss most of the real demand sitting inside it, because the units most teams count, companies, zip codes, NAICS codes, don't correspond to where manufacturing demand actually concentrates. Fixing that starts with changing what gets counted.
Why standard market coverage metrics fail industrial sales teams
A pump manufacturer selling into a territory full of automotive suppliers might look at its CRM and see twelve accounts, each logged as a single company record. In production reality, those twelve companies could operate forty, fifty, sixty facilities, each with its own plant manager, capital budget, production line, and purchasing authority. Counting the parent company as one account collapses all of that into a single line item and misses most of the addressable opportunity sitting inside it.
The tools most sales teams rely on to size a territory weren't built to see that distinction. NAICS codes and headcount, the default firmographic filters built into most CRMs, describe a company's industry classification and its general size. Neither tells a rep what a specific facility actually makes, what equipment runs its production line, or what it consumes to keep that line running. A CRM built from those inputs can show a coverage map that looks complete, every account logged, every territory assigned, but whole pockets of real manufacturing demand can still sit untouched, invisible to the team that has to find them.
Manufacturing demand density on the ground
Manufacturing demand follows production reality, not geography or company count, and that distinction is the starting point for any coverage benchmark worth using. A 40-person plant running one shift buys on a completely different rhythm than a 400-person plant running three shifts in the same metro area. Shift count alone predicts equipment load, consumption rate, and how often a facility needs to reorder, and no zip code or employee headcount will surface that information.
What a plant produces matters just as much as how it runs. Treating them as interchangeable because a CRM groups them under the same category erases the information a rep actually needs to prioritize a call.
That landscape also moves. The industrial robotics segment is expanding at a strong CAGR through 2030, a sign that automation investment is spreading well beyond automotive into food processing, general manufacturing, and other adjacent sectors. As that investment spreads, what facilities buy and when they buy it changes with it. A coverage approach built on a static account list, refreshed once a year at best, can't keep up with that kind of movement. A coverage approach built on facility-level production profiles can.
The coverage metrics that matter and the ones that mislead
Most industrial sales teams measure rep effort, and they call it market penetration. Dial counts, email volume, and total accounts assigned all describe how busy a rep has been, not how much of the addressable market that rep has actually reached, and conflating the two is how coverage gaps stay hidden in plain sight.
Adjacent B2B sales data shows what happens when rep books carry too many accounts. After reps cut their books to 200 to 250 high-potential accounts, deal sizes increased, coverage improved, and distribution across the team became more equitable. A Gradient Works customer ran a similar experiment, trimming bloated rep books down to 300 to 400 accounts, and saw win rates climb from 13% to over 20% in under a year. The underlying principle does transfer: a focused book outperforms a padded one, and more accounts assigned does not mean more market covered.
Several metrics reveal genuine coverage quality in industrial sales. Facility coverage rate measures what share of known facilities in a territory the team has actually engaged, not just logged into a system. Opportunity creation rate tracks what percentage of worked accounts convert into active pipeline; a low conversion rate against a large account list signals that the list itself is wrong. Territory opportunity balance compares total weighted addressable opportunity across reps, and territories where one rep carries dramatically more addressable revenue than another produce unearned attainment on one side and an impossible target on the other. Account coverage frequency matters most in continuous-consumption verticals like metalworking fluids and specialty chemicals, because switching costs are low and consumption never stops, so visit cadence is what determines wallet share.
Other metrics create a false sense of coverage. High dial counts and email volume against the wrong accounts produce activity, but not reach. Revenue per territory, used as a coverage proxy, can hide the fact that a small-looking territory actually contains the densest concentration of unworked demand in the whole company. NAICS-based market sizing tells a sales leader how many companies share a classification code, not what any individual facility produces or purchases, which is the only information that actually predicts demand.
Territory design built on manufacturing density versus geography-based planning
Territories built around geographic convenience encode coverage gaps into the sales structure from the moment they're drawn. A geography-first territory hands a rep a map defined by drive time and zip code boundaries. A density-first territory hands that same rep a concentration of facilities whose production profiles actually match what the rep sells. The two maps rarely overlap, and the difference compounds every quarter the territory stays unchanged.
For a territory to be balanced, total weighted addressable opportunity needs to sit within a consistent band across every rep on the team, not equal account counts and not equal geographic area. Without that discipline, some reps end up carrying far more addressable revenue than others, so one rep gets attainment they didn't earn and the next rep gets a target they can't physically hit. That imbalance looks like a performance problem on a leaderboard, but the design of the territory is what actually produced it.
The tension between geography and vertical specialization is real and worth taking seriously. Complex industrial sales runs into a different constraint: a metalworking fluids rep covering automotive, aerospace, and job shop accounts within the same geography needs a distinct technical vocabulary for each vertical, and no amount of route efficiency compensates for a rep who can't speak the customer's language. The operational standard that has emerged for industrial field sales is a hybrid model, geographic boundaries to manage travel economics, layered with production-profile clustering so reps build genuine expertise within a vertical inside their own geography.
Rep attrition is the strongest objection to redesigning territories more frequently, and it deserves a direct answer. The answer isn't to redesign territories constantly. Field knowledge about which accounts are genuinely difficult to work rarely appears in a CRM, so holding two principles together matters: no territory should carry significantly more or less total workload than the team average, and rep input has to be built into any redesign.
Trigger signals revealing uncovered demand before a competitor finds it
A well-designed territory goes stale the moment a plant down the road wins a new contract, installs a new production line, or starts hiring engineers for a process it didn't run six months earlier. Manufacturing facilities signal impending demand constantly through public-record events: new plant locations, equipment RFPs, automation and robotics investment plans, CapEx budget disclosures, new production line announcements, and engineering hiring patterns. A team with no system to catch these signals is always reacting to a move a competitor already made.
These signals appear in SEC filings, press releases, and job postings, rather than in the kind of intent data most B2B sales teams rely on. Industrial sales and standard B2B differ structurally here, so if you treat manufacturing buyers like software buyers, you miss the signals that matter.
Signals also hide inside accounts a team already owns. ERP and service data routinely carry purchase signals that never make it to the sales team: a key account ordering significantly less over several months, or service tickets spiking on an aging piece of equipment. Both are the kind of information that lives in an operational system but rarely reaches the account manager without a deliberate integration connecting the two. Metallus Inc. offers a concrete illustration of signal-driven account growth: the company reported a commercial recovery driven by improved demand across end markets, with particular momentum in vacuum arc remelt steel for aerospace and defense, winning new business with existing customers and adding new customers within that specific segment. It's a vertically targeted expansion built on reading demand signals accurately, so it isn't a broad market push.
The existing account blind spot
The fastest path to revenue growth for most industrial sales teams is the plants and production lines inside accounts the team already claims to own but has never fully mapped. Existing customers drive most of a company's revenue across B2B sales broadly, and that figure grows larger when those customers are multi-facility manufacturers whose full footprint was never logged.
Cross-sell and upsell opportunities inside existing accounts depend on knowing what each facility produces, what equipment it runs, and what that equipment consumes on an ongoing basis, information that rarely lives in a CRM populated from standard firmographic sources. The gap is structural: most CRMs hold a single company record built around headquarters firmographics, while the actual purchasing authority and the real variation in production needs live out at the plant level, spread across facilities a rep may never have known existed. Installed base intelligence, tracking equipment lifecycles, usage patterns, and service signals on an ongoing basis, gives a team the operational foundation to know when a facility is ready for an upgrade, a complementary product, or an expanded supply relationship, rather than finding out after a competitor already has.
An account team that has mapped every operating plant inside its existing customers, rather than treating the parent company as the whole account, finds pipeline that was sitting inside its own book the entire time.
Benchmarking your team's coverage against what the market contains
Genuine coverage benchmarking starts with a single question: how many facilities could the team sell to, versus how many has it actually engaged? Most industrial sales teams can't answer that question honestly, because they build their market definition from company records, not facility records. Answering it requires a sequential audit, not a single metric pulled from a dashboard.
The first step is defining the addressable facility universe: counting facilities by production profile rather than companies by NAICS code, since the real question is how many plants in a territory make something that needs what the team sells, not how many companies share a category classification. The third step calculates facility coverage rate by territory, dividing actively worked facilities by total known facilities; that number tends to come in lower than teams expect, and the size of that gap is the benchmark that actually matters.
The fourth step assesses opportunity balance across rep territories by comparing total weighted addressable opportunity per rep; an imbalance beyond a meaningful threshold points to a structural problem in how the territory was built. The sixth step measures cross-facility penetration within existing accounts: it tracks what share of a multi-facility customer's operating plants are active in the CRM against how many sit dormant.
Corvus approaches this benchmarking problem by indexing over 500,000 manufacturing plants and capturing more than 60 data points per facility, including what each plant makes, its production volume, its equipment, and real-time activity signals, so a sales team's coverage map reflects actual manufacturing density rather than an approximation built from headquarters records. That kind of facility-level visibility is what turns step one of this audit from a guess into a measurable number.
The dormant plants surfaced in step six deserve particular attention, because they represent the lowest-cost pipeline a team has. A dormant facility inside a known customer doesn't require a new relationship, a new procurement process, or a new vendor approval. It requires someone on the sales team to notice it exists.
What a well-covered industrial territory looks like in practice
A well-covered industrial territory is the one where every facility whose production profile creates demand for what the rep sells is known, mapped, and sitting on a contact cadence calibrated to that facility's actual consumption cycle.
A few characteristics distinguish genuine coverage from its appearance. Every multi-facility customer has all of its operating plants logged as independent records, and each one carries its own production profile, its own contact, and its own activity history. Rep books are sized to the number of facilities that can realistically be worked at the right frequency, not padded with dormant records that make a coverage report look better than the territory actually is. You balance opportunity across the team in weighted addressable demand, not account counts or geographic area. Trigger signals from public records and operational data flow directly into rep workflows, so when a facility expands or changes equipment, it generates a sales action within days instead of surfacing in next quarter's business review. You track cross-facility penetration inside existing accounts explicitly, and you treat dormant plants in known customers as the first priority in building new pipeline.
What separates teams that reach this level of coverage from teams that don't comes down to one operational fact. They know what each facility makes before a rep ever walks through the door, and that knowledge lives in the CRM, available to the whole team, rather than locked inside the memory of whichever rep happened to visit that plant last.