U.S. Rubber and Plastics Industry Purchasing Patterns for Chemical Suppliers

U.S. Rubber and Plastics Industry Purchasing Patterns for Chemical Suppliers.
Rubber and plastics plants as a distinct chemical sales target
What a rubber or plastics plant makes, the process it runs, and how hard that process is running together decide which chemicals it buys and on what schedule. Plastics and rubber products worldwide reached $1.55 trillion in 2025 and are on pace for $1.64 trillion in 2026, a 5.8% compound growth rate https://www.researchandmarkets.com/reports/5781128/plastics-rubber-products-market-report. A customer base that size can't be worked off instinct or a purchased contact list, and treating it that way is the most common mistake a chemical sales organization makes in this sector.
NAICS 326 is the government's catch-all code for the industry, and it lumps together tire manufacturers, injection molders, extruders, compounders, sealant producers, and hose and belting shops as if they were one buyer. The tire manufacturers, injection molders, extruders, compounders, sealant producers, and hose and belting shops lumped together under the code are not one buyer. A natural rubber compounder and a thermoplastic extruder run chemical bills of materials that point in completely different directions, and a code built to track employment or output tells a sales rep nothing about which of the two he's looking at. Selling into this sector well means throwing out the code and the headcount tally and replacing them with something closer to the plant floor: what it produces, how it produces it, and how busy the lines are right now.
The chemical categories rubber and plastics plants buy
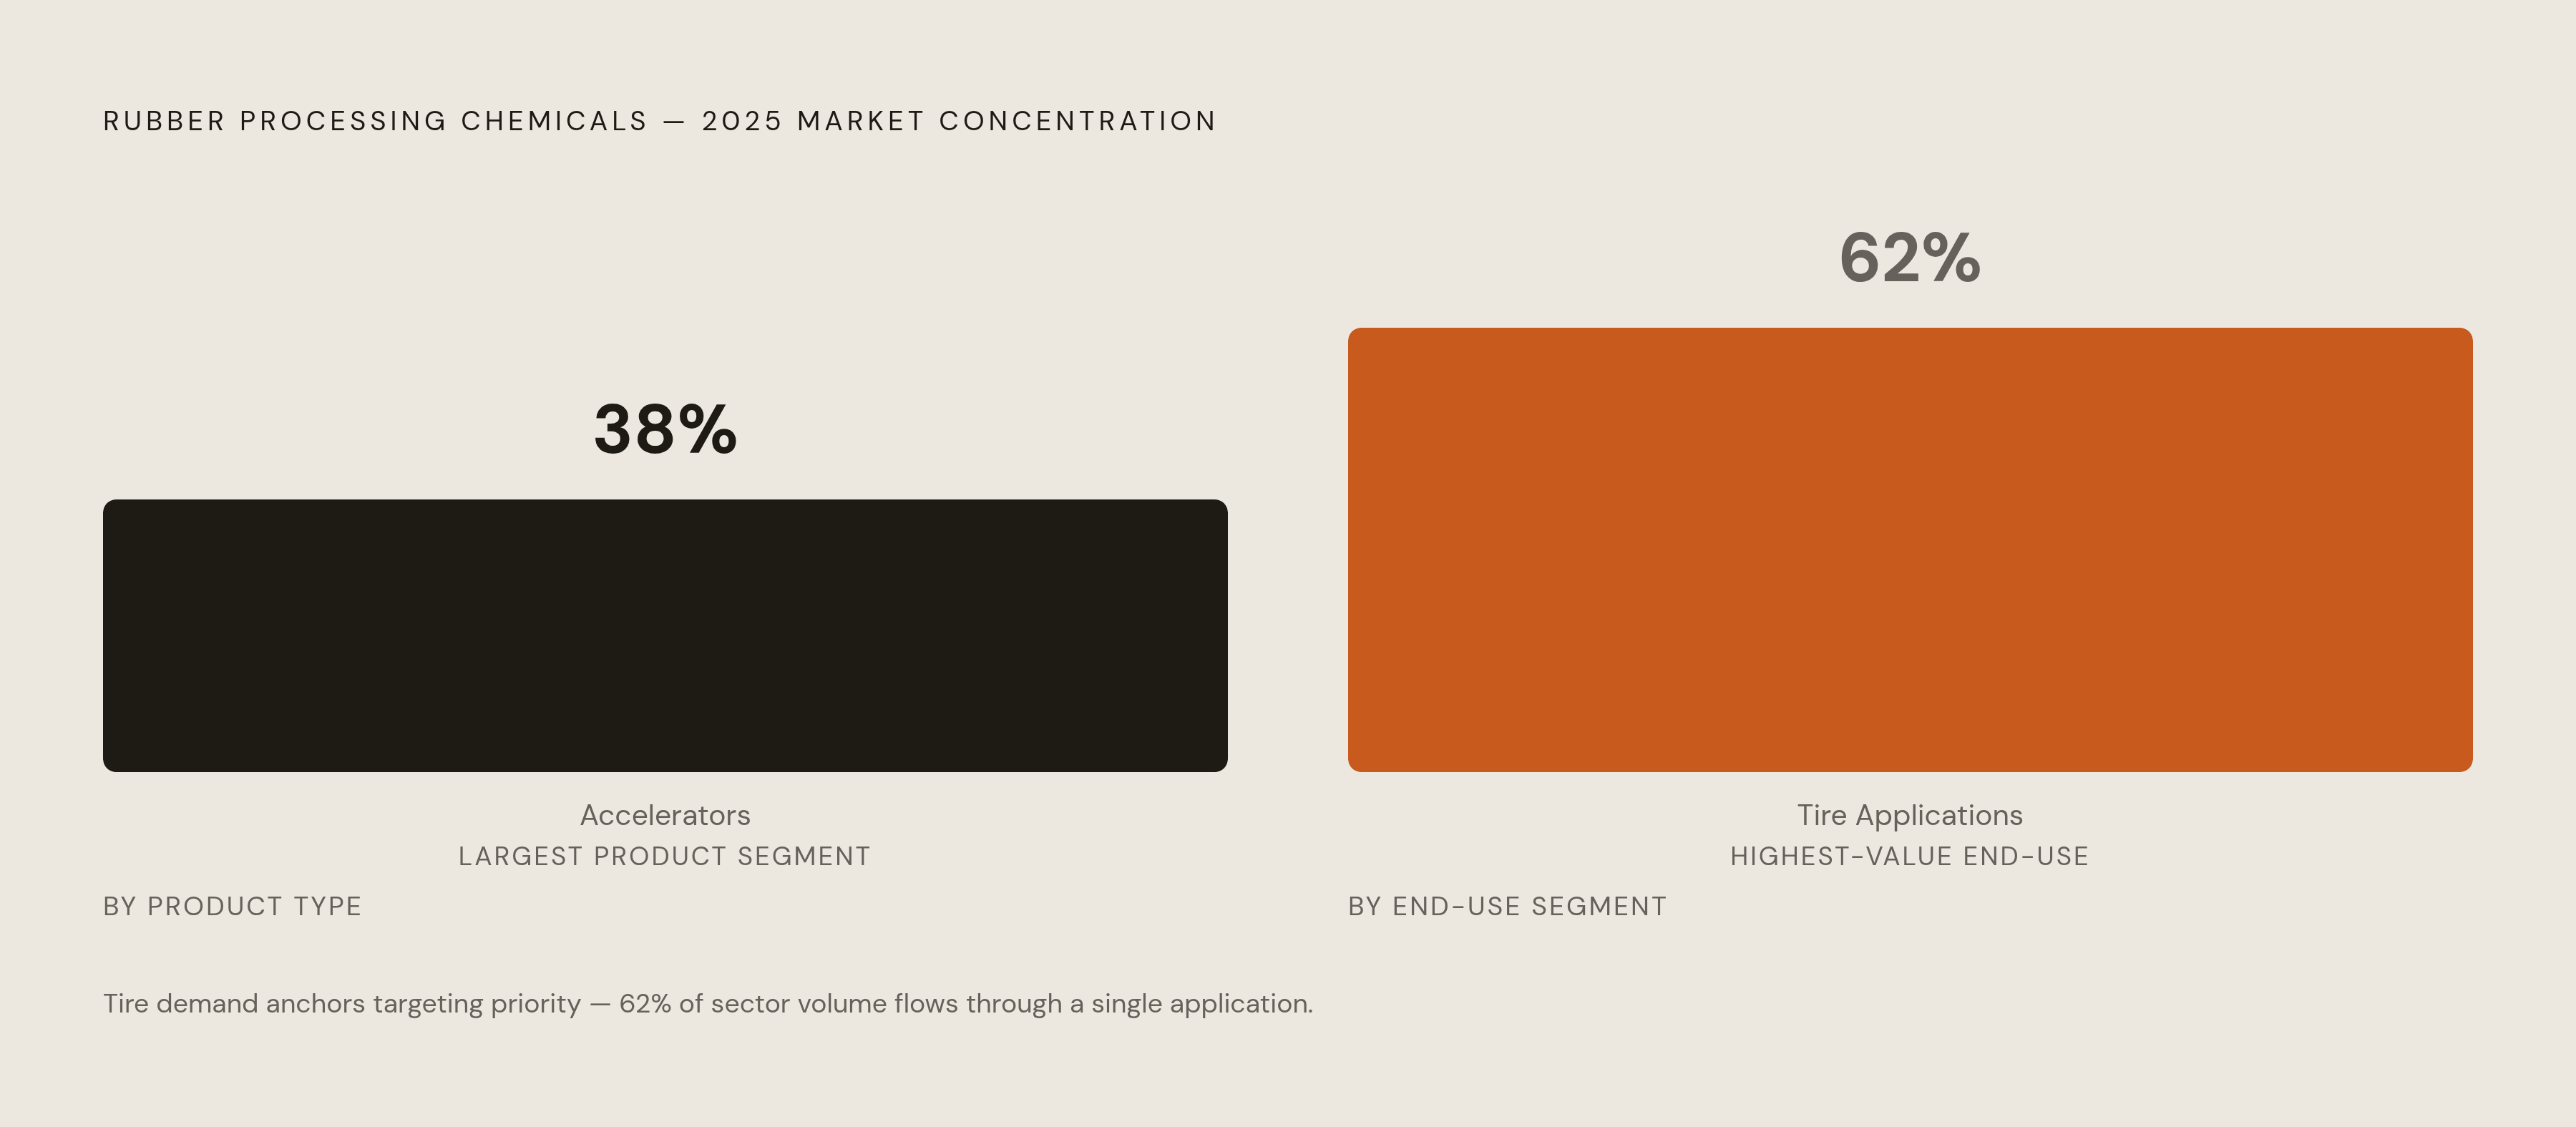
Rubber-side plants draw from a fairly consistent list: accelerators, antidegradants, silane coupling agents, processing aids and plasticizers, flame retardants, and a tail of specialty additives. Accelerators anchor the spend. They make up roughly 38% of the rubber processing chemicals market as of 2026, the single largest product segment by a wide margin, and the reason has nothing to do with preference https://www.gminsights.com/industry-analysis/rubber-processing-chemicals-market. Vulcanization can't be skipped or engineered around, so every rubber plant, no matter what it makes, needs an accelerator package on order.
Antidegradants and processing aids come next, but how much of each a plant buys shifts with the substrate running through it and what the finished part has to survive in the field. A tire sidewall and a gasket ask entirely different things of an antidegradant package, even when both start from the same rubber base.
Plastics-side plants buy a different stack altogether: plasticizers, stabilizers, impact modifiers, flame retardants, colorants, release agents. The supply relationship looks different too. Plastics formulation tracks polymer chemistry, PVC, polyolefin, engineering resin, far more tightly than rubber formulation tracks any single variable. Running rubber accounts and plastics accounts on the same sales playbook is a category error, not a shortcut.
Process type and substrate as determinants of which chemicals a plant needs
Tire manufacturing, covering tread, sidewall, and bead, consumes more accelerators and antidegradants than any other segment, and it's where silane coupling agents matter most, since silica-reinforced tread compounds depend on them for reinforcement. Sidewalls need antiozonants to survive years of flexing and weather. Tire applications alone account for roughly 62% of the rubber processing chemicals market https://www.gminsights.com/industry-analysis/rubber-processing-chemicals-market.
Industrial rubber goods, seals, gaskets, hoses, belting, run on a different logic entirely, one where substrate is the whole story. An NBR plant and an EPDM plant buy different accelerator packages, full stop, because the polymers cure differently and see different service environments. A rep who knows which substrate a plant runs already knows roughly what spec sheet he's selling against before the first conversation starts. Natural rubber applications still account for about 33% of chemical consumption across the rubber processing chemicals market, so synthetic substrates haven't replaced it https://www.gminsights.com/industry-analysis/rubber-processing-chemicals-market. They've added branches to the tree, not cut the trunk down.
Rubber compounders lean harder on processing aids and plasticizers on top of the standard accelerator spend, and custom compounders in particular range across a wide catalog of additives depending on whatever their own customers specify.
On the plastics side, injection molders and extruders pick stabilizers and plasticizers based on the polymer running the line, PVC, polyolefin, or engineering resin, and each calls for different chemistry. Regulatory pressure on phthalate plasticizers is actively reshaping this buy, pushing formulators toward alternatives that didn't need to exist a decade ago.
How capacity utilization signals near-term purchasing volume
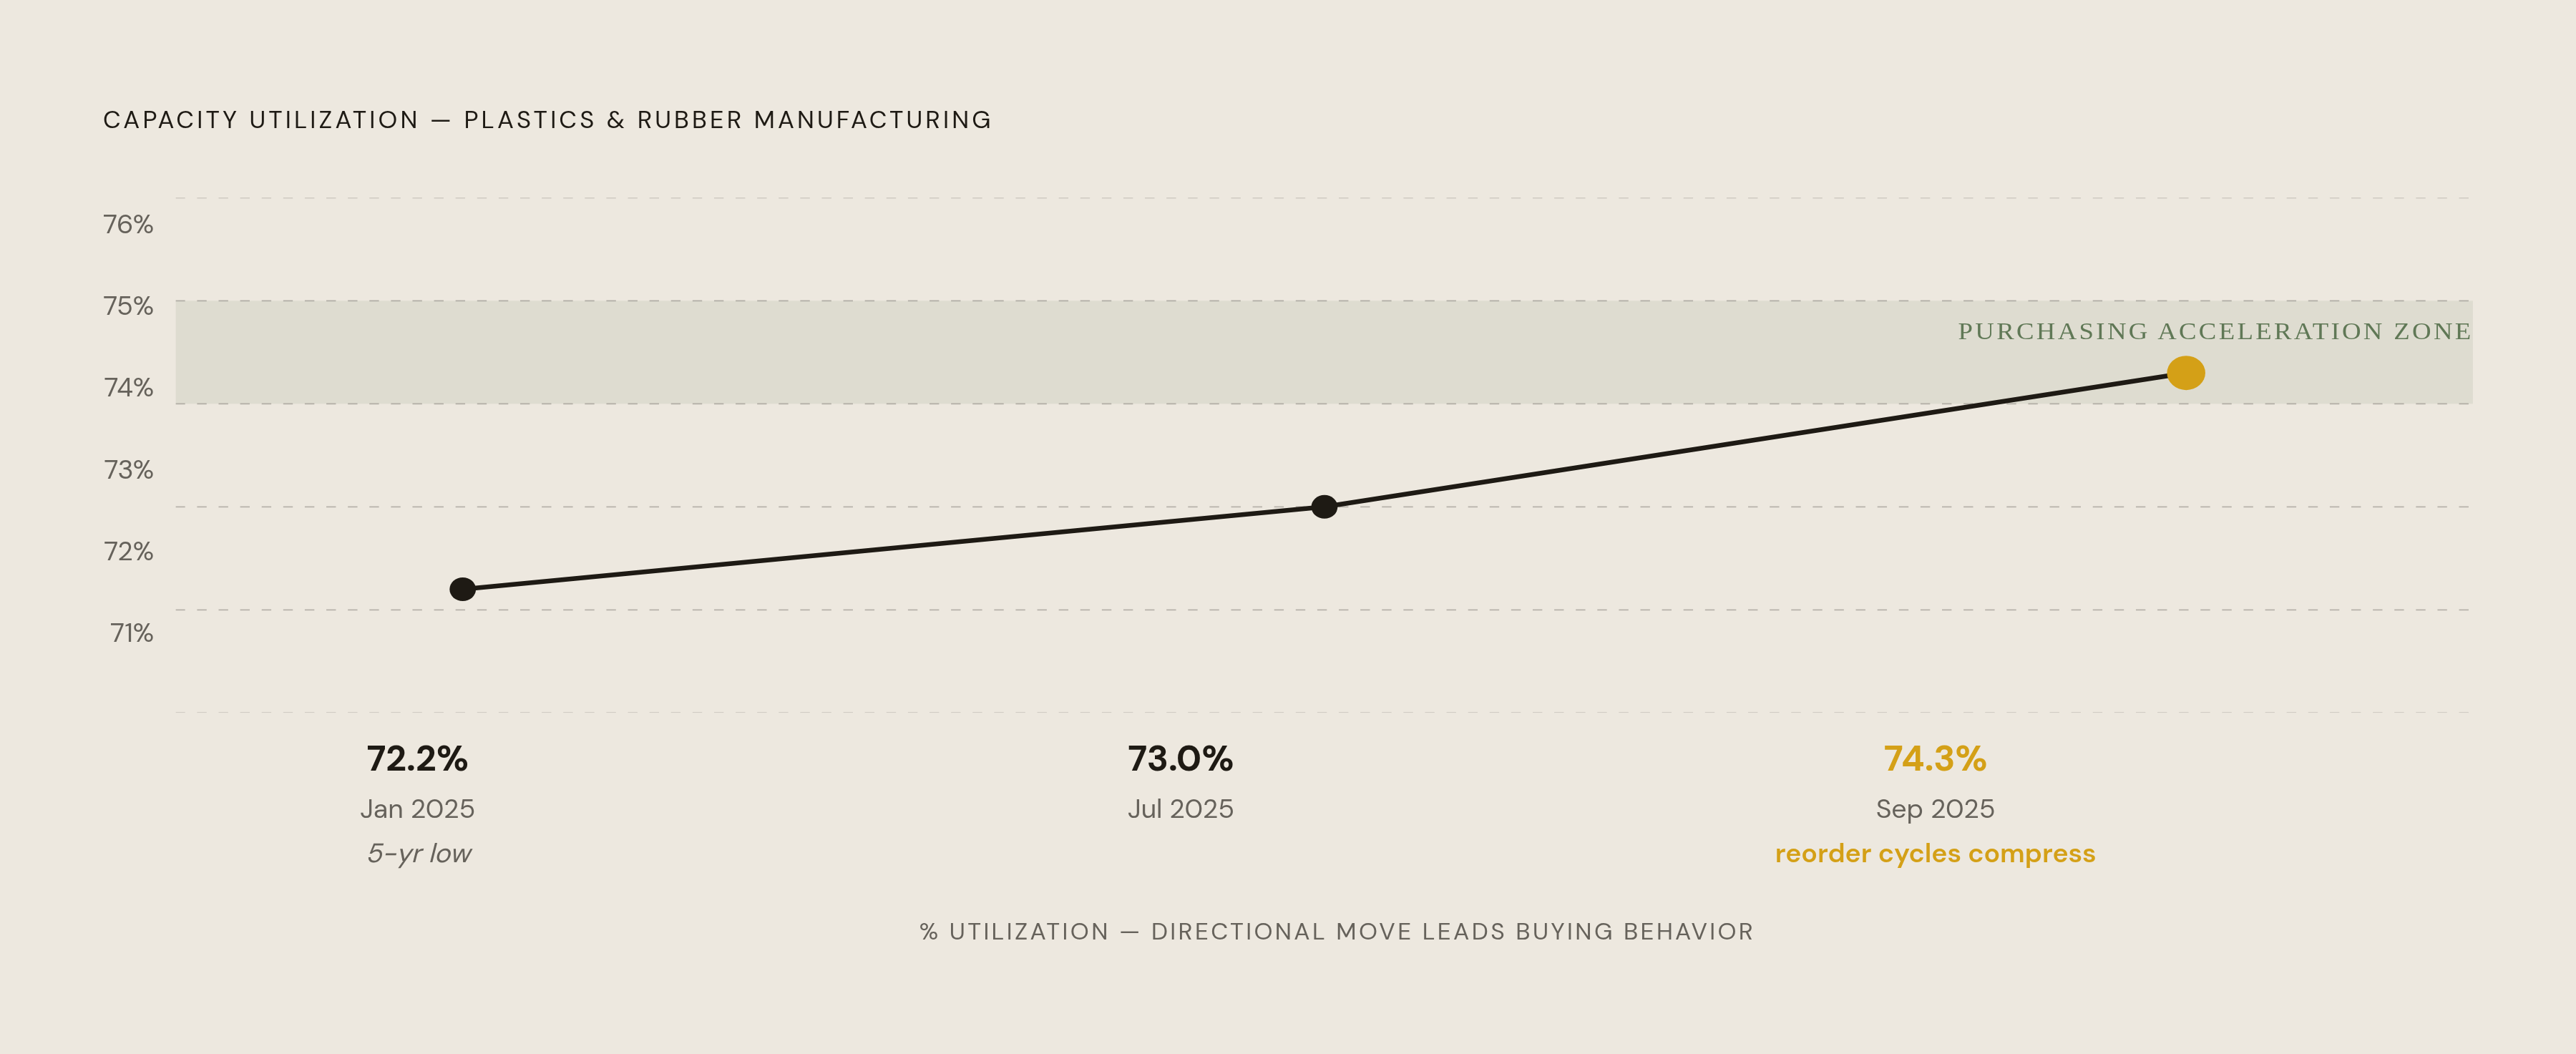
Utilization is the closest thing this sector has to a real-time gauge of chemical demand. The Industrial Production Index for plastic products manufacturing backed that up, growing 1.4% in August and another 0.8% in September, confirming the sector was accelerating consumption rather than coasting on existing stock https://blog.spotchemi.com/europe-vs-america-diverging-paths-for-plastics-in-2026/.
The mechanism is simple. When utilization climbs, plants burn through chemical inventory faster, safety stock runs down sooner than planned, and reorder cycles compress.
The reverse holds too. When utilization drops, as it did in early 2025, buyers stretch prepositioned inventory and defer whatever purchases they can put off. Eastman Chemical's Q3 2025 disclosures noted customers leaning on prepositioned stock specifically to soften the impact of tariffs, which suppressed purchase frequency in the near term even where long-run volume commitments held. A plant moving from below-average utilization toward rated capacity is a near-term purchasing signal, and FRED NAICS 326 data gives the sector-level direction while plant-level output data gives account-level precision, not a gut read on how the account feels.
End-market demand as an upstream purchasing signal
Automotive still drives more chemical volume through this sector than any other end market. U.S. tire shipments were projected at 334.2 million units in 2023, up from 332 million in 2022 https://www.researchandmarkets.com/reports/5781128/plastics-rubber-products-market-report.
Electric vehicles are layering a new signal on top of the old one. Global EV sales topped 17 million units in 2024 and were on track to clear 20 million in 2025, and that growth is lifting demand for advanced rubber compounds across tires, battery insulation, vibration control, and sealing applications. EV-linked plants are not conventional tire plants with a different logo on the purchase order. They run different performance requirements, and because of that, different accelerator and antidegradant specifications entirely. A supplier who can identify which plants actually feed EV OEMs walks in already speaking the right formulation language, instead of pitching a generic tire compound package that doesn't fit.
Construction and infrastructure activity, particularly in emerging markets, is a secondary but real driver for industrial rubber goods. Hose, belting, and seal plants tracking construction starts give suppliers another upstream indicator to watch alongside automotive. Even incremental unit growth at the scale reported by the Tire Manufacturers Association moves significant chemical volume.
The reshaping of chemical specifications by regulatory pressure and sustainability mandates
Regulation isn't a background concern in this market, it's a line item. EPA TSCA risk management rules are expected to be finalized for additional evaluated chemicals, with compliance cost budgets projected to rise above 2025 levels. That's a direct cost for plants, and by extension, a direct pressure point on which suppliers even get considered.
Sustainability credentials have moved from a nice-to-have into something closer to a qualification requirement, at least at the top of the market. Continental became the first tire manufacturer to put LANXESS's Vulkanox HS Scopeblue antioxidant into tire production, as of September 2025. It's an ISCC PLUS-certified TMQ alternative, carrying a product carbon footprint more than 30% lower than its conventional counterpart. The chemistry matters less than what it signals about buyer behavior: Tier 1 tire manufacturers are starting to specify sustainability credentials as part of supplier qualification. A supplier without a certified sustainable alternative already on the shelf risks getting disqualified at these accounts before price ever enters the conversation.
Plastics-side plants face their own version of the same pressure. Phthalate plasticizer restrictions across North America and Europe are pushing formulators toward bio-based and non-phthalate substitutes, and state-level chemical restriction activity is speeding up a shift that had been gradual until now.
How tariffs and nearshoring are restructuring supplier selection criteria
Domestic sourcing has become a competitive argument. A substantial majority of U.S. chemical procurement leaders raised their domestic supplier allocation over the past 18 months, and a large share now report domestic sourcing above 60% of total spend, up meaningfully from 2024 levels. Higher costs on imported inputs, combined with pressure on manufacturers to show North American content to qualify for tariff exemptions, turned domestic supply into something buyers actively select for rather than merely tolerate.
LANXESS answered exactly this pressure. In September 2025 the company announced new rubber processing promoter production at its Bushy Park facility in Goose Creek, South Carolina, with output beginning that November covering Aflux 37, Aflux 42, Aktiplast PP, and Aktiplast 44. A global supplier localizing production specifically to compete with North American distributors on supply reliability tells you where the market's incentives point right now. Feedstock availability has tightened further amid geopolitical disruption in some chemical categories, pushing supply security ahead of price as the top procurement priority for a growing share of buyers, whatever the price sheet says.
The competitive structure of the rubber processing chemicals supply market
The supply side has real concentration at the top and a long tail underneath. LANXESS AG led the rubber processing chemicals market with more than 15% share in 2025, and the top five players together, LANXESS AG, Evonik Industries, SI Group, Nocil Limited, and Akrochem Corporation, held 47% of the market https://www.gminsights.com/industry-analysis/rubber-processing-chemicals-market.
The remaining roughly half is spread across a large field of regional and specialty suppliers. This is a genuinely fragmented landscape, and in it, technical support and account relationships separate mid-tier suppliers from each other far more than raw scale does. Bigger isn't automatically better here, not once you're outside the top five.
Chemical distribution stays fragmented too. The top five North American distributors hold roughly 54% of the market between them, and M&A activity stays active as distributors build out regional coverage and lock in supplier access. Akrochem Corporation, based in Akron, Ohio, represents the North American distributor model: multi-facility, ISO-accredited, covering accelerators, antioxidants, processing aids, carbon blacks, silicas, and specialty additives with technical support, and expanding by acquisition into adjacent categories including paint and coatings.
The plant-level signals that tell a chemical supplier an account is ready to buy
Four signals, read together, tell a supplier when an account is genuinely in motion rather than just sitting on a list.
Process and substrate confirmation comes first, and it does most of the work.
Capacity utilization trend is the second signal. A plant climbing from below-average utilization toward rated capacity is showing a near-term purchasing signal in real time. FRED NAICS 326 data gives the sector-level direction, but plant-level output data gives account-level precision, and a plant moving from below-average utilization toward rated capacity is a near-term purchasing signal.
End-market exposure is the third. A plant with confirmed automotive or EV-linked production carries higher volume and faces tightening OEM specification requirements, which makes for a fundamentally different sales conversation than one built around a plant serving consumer goods.
Regulatory exposure rounds it out. A plant still running phthalate-based plasticizers, conventional TMQ antidegradants, or PFAS-containing processing aids is staring down a forced specification change, and that's a real entry point for any supplier holding a compliant alternative already on the shelf.
Building a territory and account plan around plant-level manufacturing intelligence
Territory design should follow production type and substrate density, not zip code lines and not headcount tallies. A rep covering every tire and automotive rubber account in the Midwest needs fundamentally different expertise and works on a different cycle time than one covering general plastics converters in the same geography. Assigning both the same way, by geography alone, wastes the rep's time and the account's patience.
Total addressable market sizing falls apart without plant-level data behind it. How many EPDM compounders sit within a rep's drive radius, what volume are they actually running, what are they buying today, and which of them already belong to a competitor: these are facility-level questions, and no industry-wide estimate answers them. A territory plan built on a plant's substrate, its utilization trend, its end-market exposure, and its regulatory exposure gives a sales organization something an industry code never will: a reason to call today instead of sometime next quarter. Capacity utilization in plastics and rubber products manufacturing stood at 73.0% in July, climbed to 74.3% by September, and had bottomed at a five-year low of 72.2% in January, a swing that appears in reorder timing well before it appears in a quarterly earnings call https://blog.spotchemi.com/europe-vs-america-diverging-paths-for-plastics-in-2026/. The E2C DX9660 engineered elastomer composite delivers 30% higher abrasion resistance compared to conventional compounds https://www.researchandmarkets.com/reports/5781128/plastics-rubber-products-market-report. U.S. naphtha exports reached 15 million barrels in March 2026 https://www.plunkettresearch.com/9-major-trends-shaping-the-chemicals-coatings-plastics-industry-insights-for-investors-consultants-and-marketing-professionals-in-2026/. Coca-Cola has set a target to increase recycled plastic content to 30% to 35% by 2035 https://www.plunkettresearch.com/9-major-trends-shaping-the-chemicals-coatings-plastics-industry-insights-for-investors-consultants-and-marketing-professionals-in-2026/.
Sources
- Rubber Processing Chemicals Market Size & Share Report, 2035
- Plastics and Rubber Products Market Report 2026 - Research and Markets
- 9 Major Trends Shaping the Chemicals, Coatings & Plastics Industry: Insights for Investors, Consultants, and Marketing Professionals in 2026
- Europe vs America: Diverging Paths for Plastics in 2026