Sales Territory Planning Template for Chemical Raw Material Suppliers
Align chemical sales territories by plant production fit, not geography.
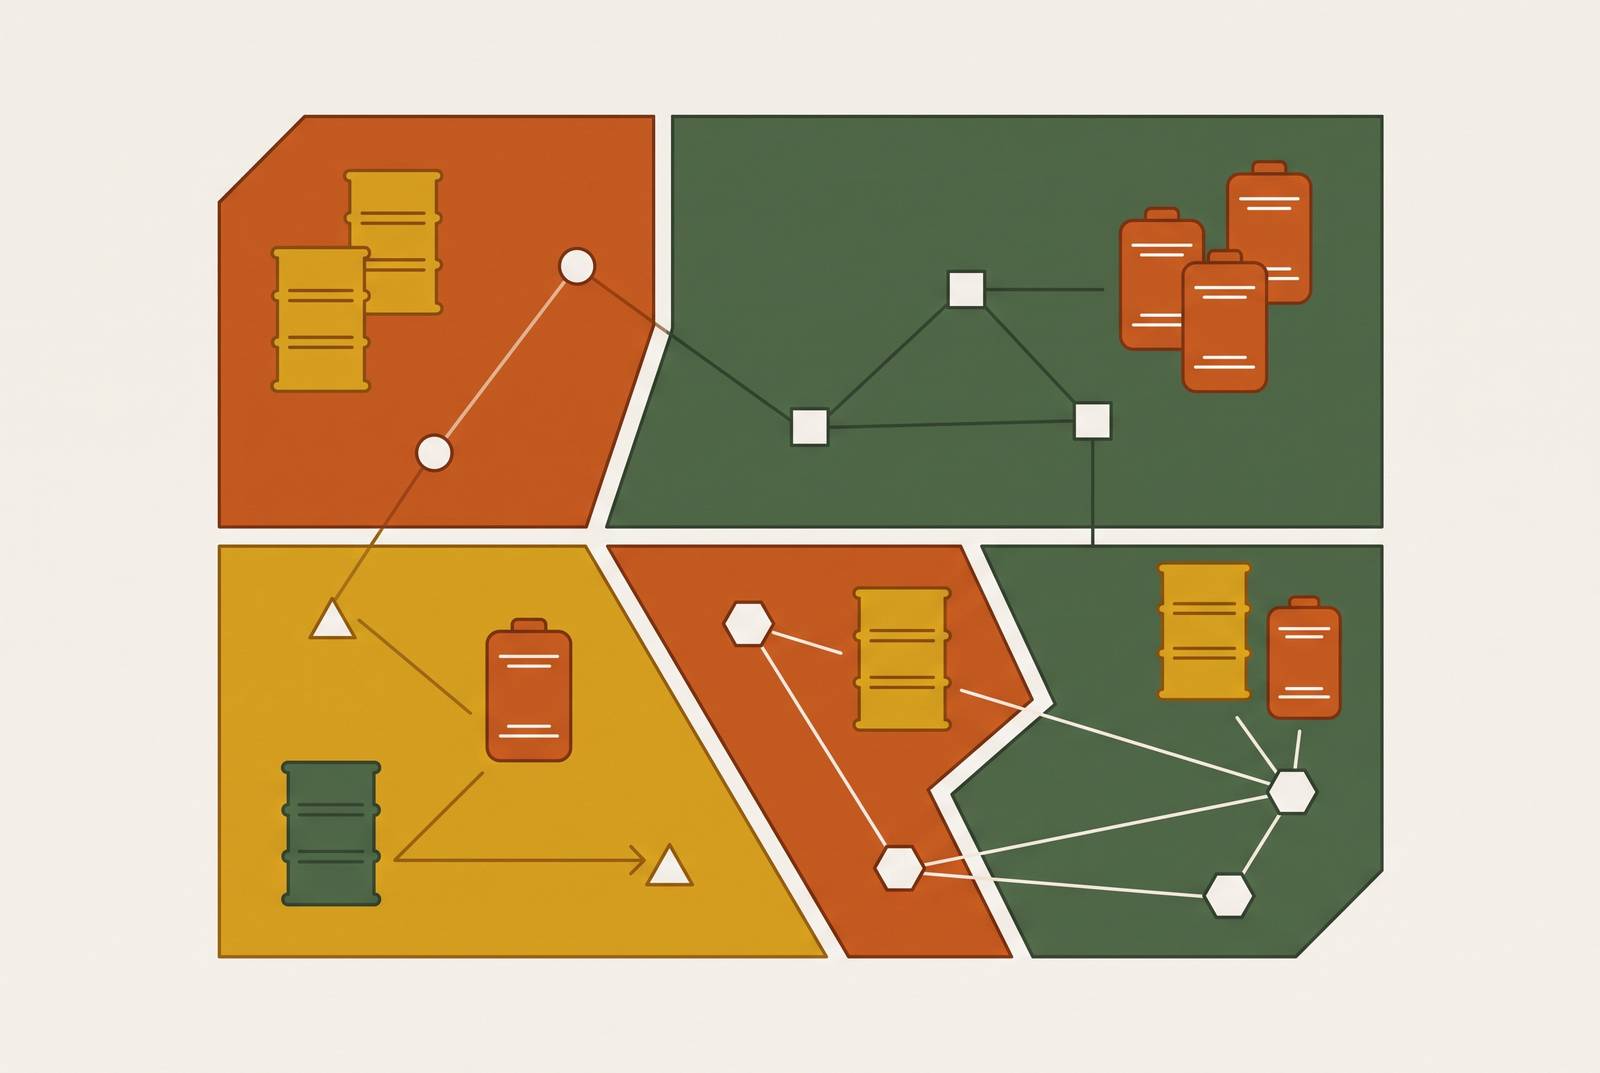
A sales territory planning template for chemical raw material suppliers should divide coverage by facility-level buying potential. Territory planning tools for manufacturing sales teams need to connect production processes, material consumption, account priority, and rep workload. The practical method is to qualify plants first, balance territories around manufacturing density, and maintain the resulting account plans in the CRM.
Why the current chemical market cycle makes territory design more consequential
Deloitte's 2026 Chemical Industry Outlook puts global chemical production growth at two percent for 2026 and expects US production volumes to contract by 0.2% for 2026. That pressure leaves suppliers less time to spend on accounts where their materials are a poor fit for the application. Customers under financial pressure scrutinize supplier relationships, shorten approved-supplier lists, and consolidate spending with fewer partners. As a result, being present in a region matters less than being relevant to the plants buying within it.
The commercial test begins before an RFQ arrives. A supplier needs to explain why its material fits a particular production process, rather than wait for an opportunity to compete on price. A well-drawn territory gives its rep enough plants that fit, the technical knowledge needed, and time to make that case. For the rep on the ground, a poorly drawn patch means spending scarce selling time establishing relevance that the territory plan should already have identified.
Why geography alone produces the wrong territory shape for chemical raw material sales
One distribution company mapping its West Coast territory discovered that the majority of its coverage area was uninhabited land. Reps had been routing through zones with zero prospects because the territory was drawn around geographic coverage. The failure was not simply excessive travel. It was an assignment method that treated physical coverage as evidence of commercial opportunity.
For chemical raw material suppliers, an industrial corridor may have dozens of qualifying plants while an area of the same size next to it has almost none. An equal geographic split gives those patches the same apparent weight despite their different buying potential. It also overlooks the expertise needed to serve them. A rep who understands metalworking fluid chemistry or surfactant performance in cleaning formulations can develop an application-specific conversation that a generalist cannot.
Geography should constrain routing to manage travel between active accounts. A hybrid model combines practical travel zones with vertical specialization and account tier. This allows the territory to reflect both plant concentration and buying complexity. The objective is a workable patch of relevant facilities.
What plant-level production data reveals that company-level firmographics hide
A company record establishes that a manufacturer exists, while a plant record explains what a particular facility makes and runs. That distinction changes the basis for qualification. A manufacturer with more than one plant may have different purchasing processes, equipment configurations, compliance requirements, and material qualification histories at each plant. Treating the parent company as one account hides the differences that determine which materials each location needs.
NAICS codes cannot resolve those differences because identically classified plants may use different production processes and chemical inputs. Headcount is also a poor substitute for consumption. A highly automated facility may run three shifts with few workers and still use large amounts of specialty fluids, coatings, or process chemicals. Plant-level data is therefore different in kind from a more detailed company directory because it supports an inference about demand.
The useful record includes production type, equipment, volume signals, environmental compliance status, and expansion or retooling activity. Those fields connect a facility to both a material requirement and a possible purchasing event. Corvus profiles over 500,000 manufacturing facilities with 60+ data points per plant, capturing production and activity information that company-level firmographics obscure. Such intelligence provides a practical alternative to assembling every plant profile through manual research.
How to identify the facilities in your territory that actually consume your materials
Start with the production processes that consume the materials being sold, then work backward to the facilities running those processes. A surfactant supplier targets facilities with aqueous cleaning lines. A corrosion inhibitor supplier targets facilities handling ferrous metals under wet conditions. An EP additive supplier targets facilities that run high-pressure metal-forming or cutting operations.
Next, use production volume signals to distinguish the scale of the opportunity. Shift patterns help show which plants use large amounts of material and which use less, while a newly added line may be a sign of an active procurement cycle. A plant running multi-metal CNC machining offers a more specific basis for discussing mixed-material cutting fluids than its company classification does. The qualification rationale should spell out that link to the process.
New environmental permits can appear months before a line starts running, while SBA 504 loan filings for manufacturing equipment show capital investment before the equipment is installed. SEC 10-K capex disclosures can flag planned spending a year or more ahead. These signals identify entry points, but they do not replace the need to establish process fit. Sizing, routing, account tiers, and call cadence all depend on getting this facility list right.
Sizing and shaping territories around manufacturing density, not mileage
Once the facilities are qualified, draw territories around a roughly equal share of addressable buying potential and account-management effort. Manufacturing density measures the number of qualifying plants, weighted by their production volume and process fit. For specialty chemical raw materials, counting qualifying production lines can give a large plant with multiple relevant lines more potential than a dozen small accounts in the same zip code.
This approach makes workload imbalance visible before assignments are finalized. Industrial clusters, chemical corridors, and automotive manufacturing belts concentrate demand without regard to state boundaries. Giving one rep a dense cluster and another a broad but sparsely populated area can overload the first while leaving the second with unused capacity. Equal mileage does not correct that mismatch because travel distance is not a measure of consumption.
Keep strategic and named accounts static where reassignment would disrupt valuable relationships in complex, long-cycle sales. Redistribute the remaining whitespace accounts as plant density shifts, while retaining manageable travel zones. The output should be a map of facility clusters with an account count and estimated revenue potential for each rep patch.
Building the account tier and call-cadence structure inside a territory
Account tiers should be based on plant-level signals instead of past revenue, how long the relationship has lasted, or a rep's hunch. A-accounts are active customers with strong process fit, high volume potential, or expansion signals. They warrant contact roughly every two weeks, in-person technical engagement, and proactive cross-sell monitoring. Their priority reflects the work the plant can support.
B-accounts are qualified prospects with confirmed process fit but no purchasing relationship, or existing customers with untapped adjacent needs. Monthly contact and structured qualification activity suit those accounts. C-accounts match the process profile but are small, early-stage, or not yet budget-active, so quarterly touchpoints and automated content are appropriate until a trigger elevates them. A new equipment lien or production expansion permit should prompt an automatic elevation because it signals entry into an active procurement cycle.
Within those tiers, keep a top-25 target list ranked by how likely each account is to convert and how much revenue it could bring. Speak with the relevant plant manager, procurement director, EHS director, or quality manager, using the criteria that person uses to assess materials. The calendar must also accommodate the different rhythms of initial qualification and repeat purchasing. Months of lab evaluation require sustained technical follow-up, while qualified reorders operate on a much shorter cycle.
What to capture in the territory planning template: a field-ready structure
The template should begin with a territory profile that establishes the scope of the assignment. Record the total number of qualified facilities by process type, an estimate of addressable volume for each product category, a manufacturing density map, and a breakdown by vertical. This gives the rep and sales leader a common view of what the patch contains. It also provides the baseline for later workload reviews.
Next, create one facility record for each plant. Capture the facility name, location, primary process type, estimated consumption tier, current supplier status, last contact date, and most recent activity signal. Record supplier status as incumbent, prospect, or unknown. The purpose is to make both the commercial position and the production rationale visible in the same record.
Account tier assignments and the top-25 target list should follow the facility records. Each tier assignment needs an A/B/C classification, visit cadence, next planned action, and the trigger behind the classification. Each target-list entry needs a rank by conversion probability and a one-line rationale. That rationale should explain why now is the time to contact the plant.
The activity log and pipeline should record which samples were submitted and their outcomes, keep meeting notes in time order for each facility, and tag opportunities to individual plants. Cross-sell and upsell flags should then distinguish unmet adjacent process needs from reorder volumes approaching pricing or product-tier thresholds. These records keep the qualification history and chances to grow the account available when reps change.
Finally, maintain the records in the CRM so that the template supports weekly execution and quarterly review. Through Corvus's integrations with Salesforce, HubSpot, and Dynamics 365, plant-level data and real-time activity signals can update account records within existing workflows. The intelligence layer supplies the production context, while the CRM holds the account actions and history.
How cross-sell and expansion signals inside existing accounts reshape territory priorities over time
Plant-level intelligence also reveals revenue opportunities within facilities that already buy from the supplier. The distinction between upsell and cross-sell determines the next action. Upsell follows rising consumption of an existing product as reorder volume approaches a new pricing or product tier. Cross-sell follows a documented process need for an adjacent product category that the facility does not yet source from the supplier.
Purchase history alone can show the first pattern but leaves the second largely hidden. A rep who knows only what the plant orders has little basis for identifying what else it needs. A fuller process profile exposes the gap between current purchases and the materials used across the facility. That makes account expansion part of territory planning rather than an incidental result of a customer conversation.
Changes in production can shift those priorities even when the account has an established relationship with the supplier. A new line or equipment configuration may bring a need for an adjacent chemistry and a reason to start qualification work again. Review cross-sell flags and upsell thresholds against every A and B account at least quarterly. Then update the top-25 target list to reflect both new-prospect signals and expansion opportunities within the existing base.
Putting the template to work: what changes when plant-level data runs the territory
A rep working from a geographic list must first assess each account's fit for the pipeline. A rep working from a qualified plant list starts with the facility's production process, its implied material needs, and any signal that makes contact timely. Time is allocated differently, with relevance established before outreach.
That structure also makes the territory more durable. When facility records contain process profiles, tier rationales, and qualification history, a new rep inherits more than names and past orders. The account's technical context remains available through the handover. This matters in specialty chemical sales because losing that context can mean losing months of qualification work.
The immediate next step is to audit current territories against a plant-level facility list. Identify qualifying facilities missing from the CRM as individual plant records, then use that gap as the baseline for restructuring. For this audit, Corvus can supply production profiles, process data, and activity signals and feed the resulting facility records into the CRM.