Using Plant Concentration Data to Set Realistic Quotas
Plant density maps reveal true territory potential beyond corporate account lists.

A sales leader stands in front of a board and defends a number that was never built to survive the question "why this much, from this territory." That is the moment the quota breaks, not at the end of the quarter when attainment comes in low, but at the start, when the number was set. Most industrial sales quotas come from historical performance, a top-down growth target, or some blend of the two, and neither method asks what a given territory can actually produce. A rep who underperformed in a thin market looks weak on paper. A rep who overperformed in a dense one looks like a star. Neither number says anything true about the opportunity each rep actually had in front of them.
Xactly's 2026 quota management framework names this problem directly by separating three ways to build a quota: historical, market-based, and predictive. Used alone, historical data locks in whatever inequities already exist in how territories were drawn, because it carries old patterns forward without asking if they were ever grounded in real demand. It also misses behavioral signals, like how deals move through the pipeline in a given market, because historical data only counts what already closed. Xactly's framework holds that bottom-up capacity, paired with predictive insight, lets a sales leader defend a quota with a method behind it.
The industrial sector feels this failure acutely because the records used to build the quota rarely include the unit that actually buys, the plant. A number built on the wrong geography of demand will be wrong no matter how carefully the math is done afterward. Fixing that starts with naming where the mismatch actually lives: in the account itself.
The wrong unit of account for a manufacturing territory
In software and services, the company is the account. One contract, one budget holder, one mailing address, and the CRM record matches the actual unit of demand without much friction. Manufacturing does not work that way. A single parent company can run a dozen facilities, and each one has its own production manager, its own maintenance budget, its own procurement cycle, and its own purchasing behavior that has nothing to do with what the plant three states over is doing.
When a CRM record is keyed to corporate headquarters, field reps drive past plants that never appear on any account list they've been handed. Territory coverage looks complete in the CRM. The real buying locations sit unworked, invisible to the person whose job is to call on them.
A pump manufacturer's CRM carried one global OEM as a single account based in Chicago. Plant-level enrichment resolved that one record into more than a dozen facilities spread across five states, two of which were in the middle of expansion and had gone entirely unworked by the rep assigned to the "account." That is not a data entry error. That is a territory map built on the wrong unit, and it means a sales organization had already decided, without knowing it, to ignore two expanding plants that were ready to buy.
The error compounds the moment a quota gets attached to it. A territory sized to three corporate accounts might contain far more facilities than that, or far fewer, and the quota assumes neither. It just assumes the account list is the territory, and in manufacturing, the account list and the territory are rarely the same thing.
Plant concentration data versus a facility list
Plant concentration data is a density map of real industrial activity: how many plants of what type, size, and production profile sit inside a defined geography. That is a different object from a facility list, and the difference matters for what a sales leader can actually do with it.
A facility list tells you where buildings are. Concentration data tells you what those buildings produce, at what volume, on how many shifts, and with what equipment, which are the facts that actually determine how much a plant buys and of what kind. A three-shift plant buys more consumables than a one-shift plant of the same square footage. A high-volume plant is a larger chemicals or fluids account by definition, simply because volume and consumption move together. A precision CNC shop needs different fluids than a stamping plant does, because the two processes put different demands on the materials that keep them running. Older equipment also matters, because it signals a coming replacement cycle and needs different service than a plant that just retooled.
Concentration data answers a territorial question that a facility list cannot: how many qualified opportunities exist within a driveable radius, and how are they spread across the geography a rep is actually expected to cover. Platforms built on primary industrial research, meaning continuously verified plant locations, ownership records, products produced, and production activity, generate this kind of density picture because they are built to track plants as the unit of record. Generic business databases built on NAICS codes and headcounts were never built for this question, because they treat the company, not the plant, as the thing worth counting.
Reading concentration density as a quota input rather than a prospecting list
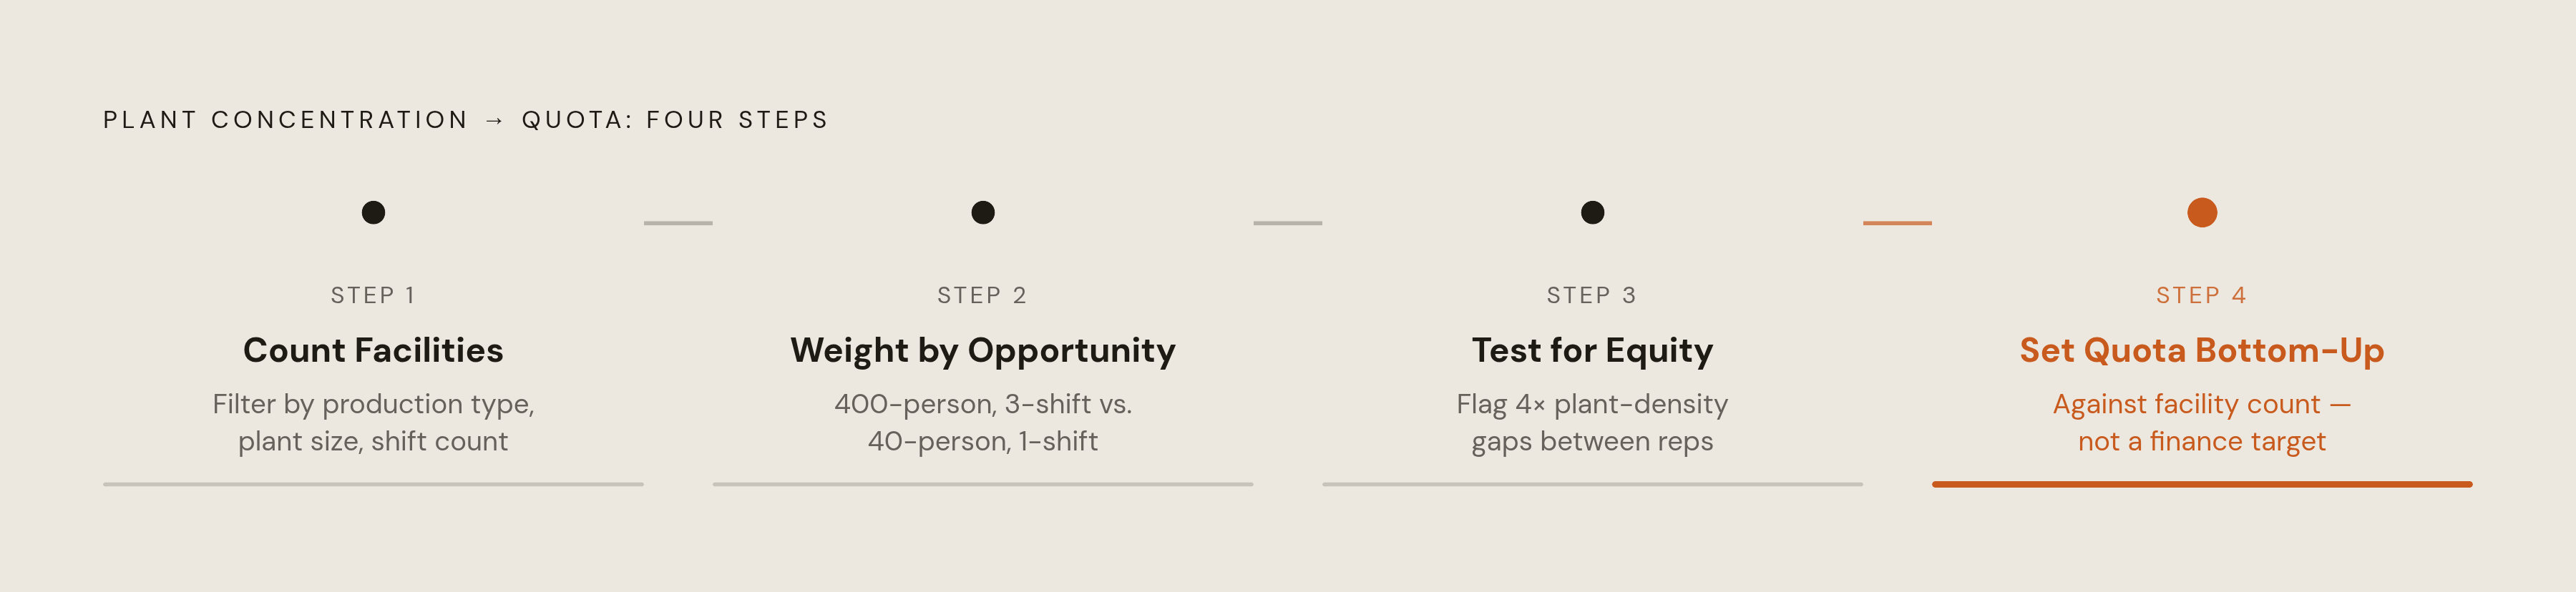
Concentration data becomes useful for quota-setting once it is translated into three answers at the territory level: how many addressable facilities exist, how large the aggregate opportunity is, and how evenly that opportunity is spread across the reps responsible for it. That translation happens in four steps.
The first step counts qualified facilities, not companies. Filtering by production type, plant size, and shift count produces the number of plants that actually match the product's ideal customer profile inside the territory's boundaries, which is a very different number than the count of corporate accounts on file.
The second step weights that count by opportunity size. A 400-person plant running three shifts of continuous production is a fundamentally different revenue opportunity than a 40-person plant running a single shift, even if both are counted as "one plant" in a flat count. Production volume and shift data let a sales leader tier accounts by realistic spend potential.
The third step tests the resulting territories for equity. If one rep's territory holds four times the qualified plant density of another's, a uniform quota punishes the rep stuck in the thin territory, and it lets the dense territory go under-extracted. Xactly's framework treats territory quality and addressable opportunity as the foundation quota fairness has to rest on, and plant-level density is the clearest way to measure that quality in an industrial market.
The fourth step sets the quota against the bottom-up count, not a top-down growth target handed down from finance. The question to ask is what the territory, as it actually exists, can support. A number built this way gives a sales leader something to defend to a board with a method attached to it, and gives the rep carrying that number a figure grounded in what the territory can actually produce.
Capacity utilization data and the timing dimension it adds to concentration-based quotas
Plant count establishes the size of an opportunity. Capacity utilization tells a sales leader when those plants are actually buying, and the Federal Reserve publishes that signal every month at no cost to anyone who wants it.
The Fed's G.17 release tracks industrial production and capacity utilization on a monthly basis, broken out by sector. As of August 2026, manufacturing capacity utilization stood at 75.7 percent, below the long-run average for the sector. That single number carries real operational meaning. When utilization climbs toward and past historical averages, plants are running hard: consumables burn faster, equipment runs longer between replacements, maintenance intervals shorten, and procurement urgency rises across the board. When utilization sits below average, as it does now, plants manage costs more carefully and stretch their buying cycles out.
A quota set at the same level in a high-utilization quarter and a low-utilization quarter asks reps to hit a number that ignores what the broader market is actually doing. Utilization data gives a sales leader a principled basis to adjust that quota midyear, rather than waiting for a quarter of missed attainment to deliver the same message the Fed already published for free.
The G.17 breaks utilization out by major industry group, so it reports manufacturing separately from mining and utilities. So a metalworking fluid or specialty chemical seller can read a sector-specific signal, instead of an aggregate national number that blends industries with nothing in common.
Activity signals that separate urgent accounts from background noise
Plant count and utilization set the baseline size of an opportunity. Within that baseline, the plants worth calling first are the ones showing signs of active change, because those signs mark an open buying window rather than a plant that might eventually become a customer.
Four signals carry the highest urgency in manufacturing sales. A new plant or facility opening needs new equipment and new supply relationships built from nothing. A new equipment purchase or RFP means a procurement cycle is already open and moving. An announced capital expenditure increase is spending the board has already approved, not a number someone floated in a planning meeting. Shift additions mean production is outpacing current capacity, which creates immediate demand for consumables and maintenance support.
A plant adding a second or third shift is a consumables volume event happening in real time for a specialty chemical or metalworking fluid rep, and the rep who reaches that plant first captures the volume the rep who waits does not.
Signals stack, and stacked signals say more than any one of them alone. If a plant announces a new facility, a CapEx increase, and hiring activity for automation engineers, that describes a buyer actively in motion. That is a different account than a large plant that is simply large and has been for years. The quota implication follows directly: a territory's real potential within a given planning period is the count of plants showing active signals right now, not just the count of qualifying plants. Signal density matters as much as facility density when the sales cycle is short enough to make or miss an open window.
Cross-sell and upsell capacity that plant concentration data surfaces inside existing accounts
For most industrial sales teams, the fastest incremental revenue available does not sit in the next territory over. It sits inside accounts the team already owns, in plants no rep is currently calling on.
The Chicago pump manufacturer case makes the point directly. The rep managing what looked like one global OEM account had been missing two mid-expansion plants located in other states, simply because those plants never appeared in the rep's account map. Those plants were already buying from someone else by the time anyone noticed they existed.
Specialty chemical and metalworking fluid buyers are increasingly rationalizing procurement across their own facilities, preferring standardized specifications and supply terms across every site they run. A supplier who maps every plant a customer operates and builds one consolidated program across those sites can capture a much larger share of that spend than a supplier servicing individual locations opportunistically, one purchase order at a time.
Cross-sell and upsell opportunity inside an existing account follows the same plant-level logic as new-territory prospecting. A customer facility that just added a production line, promoted a new operations manager, or expanded into a new process type represents a triggered opportunity, not a routine contract renewal. Account growth quotas set without knowing how many plants an existing customer runs, and which of those plants a rep is actually serving, rest on the same shaky ground as a new-territory quota set without a facility count to begin with.
The data quality problem that undermines concentration-based quotas
A quota model built on stale concentration data can end up worse than one built on last year's rep performance, because it creates the appearance of precision without the substance of it.
Plant firmographics change constantly. Facilities open and close, shift counts shift up and down, production lines get added or idled, ownership changes hands. A concentration map that is a year old in a fast-moving industrial market no longer describes the territory a rep is actually driving through.
Enrichment has to run continuously, not as a one-time project completed during annual fiscal planning. A team that enriches its CRM once a year and then works off that same data for the next eleven months is working from a snapshot that decays a little more every week. Platforms that continuously verify plant locations, ownership, and production activity through primary research, rather than aggregating from secondary sources, reduce this decay structurally, because the refresh is built into how the data gets collected rather than left to depend on a buyer's internal operations calendar.
Smaller industrial sales teams face a real trade-off here: continuous enrichment takes a sales ops investment that not every organization can sustain. So for those teams, a concentration-based quota model refreshed quarterly still rests on firmer ground than one built on annual corporate headcounts pulled once and never revisited.
Connecting concentration data to the CRM and quota tools sales leaders already use
Plant-level concentration data changes quota outcomes only when you feed it into the CRM and planning tools your sales organization already runs on. Left in a standalone spreadsheet, it stays a research exercise that nobody in the field ever sees.
When plant-level records, meaning facility count, production type, shift count, and activity signals, get loaded into the CRM as accounts rather than kept in a separate system, territory planning, quota modeling, and pipeline tracking all draw from the same ground truth. A rep working a territory and a sales leader setting that rep's number are then looking at the same plants, the same shift counts, and the same signals, rather than two different pictures of a market that was never the same market to begin with.